GEAS Project Laboratory Exercises
Here is a short listing of our laboratory exercises. The complete set is available in PDF-format, with an accompanying instructor's guide. Our materials are copyrighted; please do contact us if you are interested in using them in an educational setting.
The spectral analysis tools at the end of the list are part of a collaboration with the Research-Based Science Education for Undergraduates (RBSEU) program, at the University of Alaska at Anchorage and Indiana University. We are currently working on companion projects regarding finding novae in the Andromeda Galaxy and studying near-Earth asteroids.
We also offer reviews (including practice problems) of representing numbers, using scientific notation with significant figures, and units conversion.
Lab #1. Fundamentals of Measurement and Error Analysis
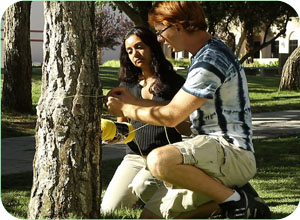 | Students design, conduct, and critique simple experiments based on their immediate surroundings. Basic statistical tools are introduced, including histograms, mean values, and standard deviations for repeated measurements of a single quantity, linear fits to xy data, and correlation coefficients. Students use a plotting package to analyze data from their own experiments, and compare their results with those generated by peers working from common, student-driven experimental descriptions. |
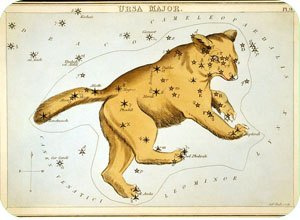 | Students observe the evening sky over an eight-day period, tracking the movement and changes in the appearance of the Moon, and identifying the North Star. They combine their own observations with a theoretical model governing the orbital motions of the Moon and the Earth. They strengthen their understanding of how and why the Moon appears differently at different times of the day, month, and year. Students also construct their own sextants from household materials and use them to measure the elongation angle between the Moon and the Sun, and the lunar altitude above the horizon. They use these data to make concrete predictions about future events on the celestial sphere, and also estimate their own latitude here on Earth. |
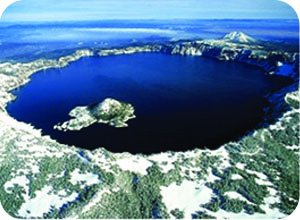
Lab #3. Cratering and the Lunar Surface
 | Students explore surface evolution on Terrestrial planets and satellites, learning about the science behind relative and absolute age-dating techniques. They conduct an experiment in creating their own impact craters, and then determine a relationship between crater size and projectile velocity based on their own data and theoretical considerations. The data analysis component is focused on relatively pristine lunar data, and then connects the results to the known cratering record for our own planet Earth. |
Lab #4. Cratering and the Martian Surface
 | Students learn about the history of the Martian surface, and then determine ages for regions scattered across the globe based on their own estimates of surface crater densities drawn from NASA high-resolution THEMIS images. Their results are linked to global trends based on volcanic and water evolutionary patterns found at various elevations and locations. We introduce the concept of logarithmic relationships and plots, and evaluate data utilizing the basic statistical measures introduced in our first laboratory exercise. |
Lab #5. Parallax Measurements and Determining Distances
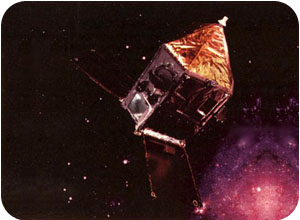 | Students explore the trigonometric parallax technique for determining distances to objects, constructing a simple parallax measurement tool and comparing direct and parallax-derived measurements for distances out to fifty feet. We then apply the basic technique to nearby stars in the Milky Way galaxy, and connect the results to the fundamental distance scale for the universe. |
Lab #6. The Hertzsprung-Russell Diagram and Stellar Evolution
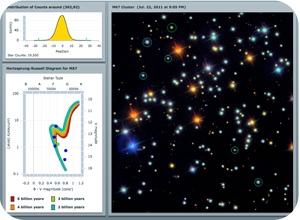 | Students explore the basic phases of stellar evolution on and beyond the Main Sequence, and learn to utilize a Hertzsprung-Russell (color-magnitude) diagram to understand the relationship between fundamental parameters for stars such as mass, luminosity, temperature, and age. A detailed study of the M67 cluster enables students to fit radial profiles to individual stars, place them on the cluster color-magnitude diagram, and then derive an age estimate for the cluster based on the Main Sequence turn-off point. |
Lab #7. Hubble's Law and the Cosmic Distance Scale
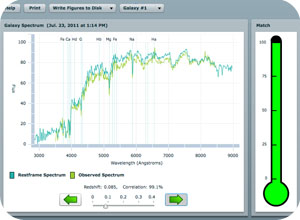 | Students learn about Hubble's Law and the basic geometry of our expanding universe. They fit elliptical profiles to the brightest elliptical galaxies drawn from large clusters, treating them like standard candles in order to determine their distances based on expected sizes and luminosities. They then determine redshifts from spectra, and compare the quality of their distance estimations based on statistical and direct measures. |
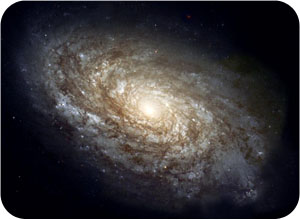 | Students explore the basic properties of galaxies, including luminosity, size, morphological classification, and stellar populations. Optical images and spectra are used to illustrate the importance of various factors. |
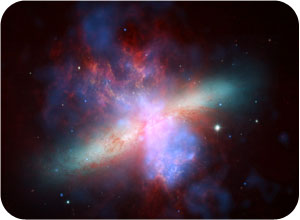 | Students analyze active galactic nuclei (AGN) spectra, determining redshifts and fluxes from specific emission and absorption features indicating the presence of various elements. Profiles are fit to individual lines, allowing measurements of line widths and fluxes for various species. A second tool allows for the analysis of stellar spectra for dwarf and giant stars of various spectral types. In addition to line fits, blackbody curves can be fit to the continuum levels to determine surface temperatures. |