Nicole Vogt » Astronomy Laboratory Exercise Tools
Astronomy is well-suited for engaging students through both hands-on and data-driven activities. The effects of ideas such as impact cratering and parallax estimates can be explored through direct experimentation, while sky observations of the Moon, the planets, and stars can be conducted from many locations without the need for telescopes or perfectly clear skies (though both are indubitably helpful!). A wealth of modern, high-resolution astronomical images and spectra can provide a window into the formation and evolution of solar systems, stars, and galaxies throughout the Universe. With clear tools and guidance, students can use these resources to explore the Universe for themselves.
The following panels show images of seven web-applications I have developed for use in astronomy laboratory exercises. You may click on any image to examine the actual web-application it represents. These tools have been developed as components for a set of distance education-friendly exercises, which can be explored here. (Detailed instructions for how to use the tools, including video tutorials, are found within the exercises.)
 |
 |
| As part of an introductory exercise on the fundamentals of experimental technique and measurement analysis, students learn to create histograms (left) and to evaluate mean values and standard deviations for sets of measurements. An exercise on the surface evolution of Terrestrial planets (right) helps students to measure the surface crater density across a variety of environments, and then to derive age estimates for various regions on Mars. | |
 |
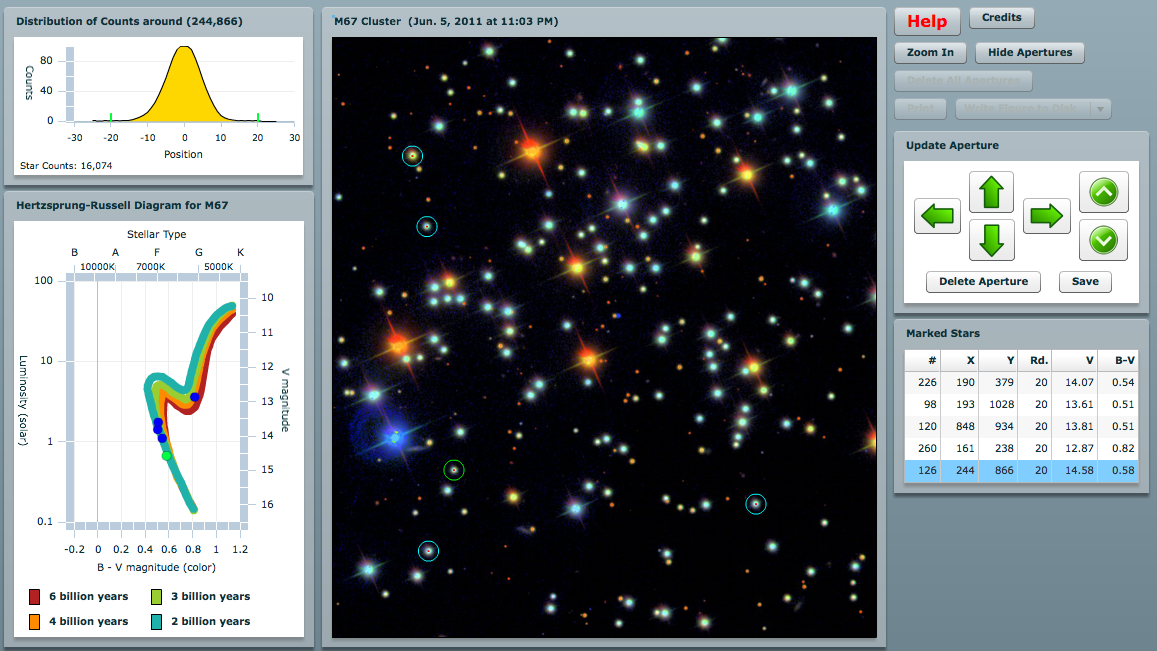 |
| While studying stellar evolution, students can identify hydrogen, helium, and metal features in stellar spectra for stars of various temperatures (right), and by fitting radial profiles to light curves of cluster stars (right), populate a cluster color-luminosity diagram and determine an age for a stellar cluster. | |
 |
 |
| Students learn about the structure and evolution of galaxies, as well as the extragalactic distance scale, by analyzing images (left) and spectra (right) of galaxies in the local and distant universe. | |
 |
 |
| By studying the spectra of active galactic nuclei (AGN), students are able to determine redshifts and distances to objects (left), and fit detailed line profiles to individual features to estimate luminosities, equivalent widths, and other line properties (right). | |
These web-applications are platform-invariant (they can be run on a Windows PC, a Mac computer, or under the Linux operating system), and do not require that any software be downloaded or installed onto the user's computer. Students can immediately engage with astronomical images and spectra obtained with a host of ground- and space-based observatories, as well as from NASA spacecraft missions.
This material is based upon work supported by the National Science Foundation (NSF) under Grant No. AST-0349155 and the National Aeronautics and Space Administration (NASA) under Grant No. NNX09AV36G. Any opinions, findings and conclusions or recommendations expressed in this material are those of the author(s) and do not necessarily reflect the views of the NSF or NASA.