 |
| Line | Wavelength | FWHM | Instrument | Image Scale | Formation |
| (Å) | (Å) | ( per pixel) | Height (km) | ||
| Ca II K3 | 3933.7 | 0.30 | Halle | 0.33 | 1800-20001 |
| H | 6562.8 | 0.21a | UBFb | 0.18 | 1200-17001 |
| Mg I b2 | 5172.7 | 0.13a | UBFb | 0.18 | 700-7502 |
| Mg I b1-0.4 Å | 5183.2 | 0.13a | UBFb | 0.18 | 2003 |
The observational set-up at the DST has been described in detail in Chapter 3. For this study, time series analysis of the Ca II K3, H core, Mg I b2, and Mg I b1-0.4 Å data were used to provide information as a function of height throughout the chromosphere (Table 5.1).
 |
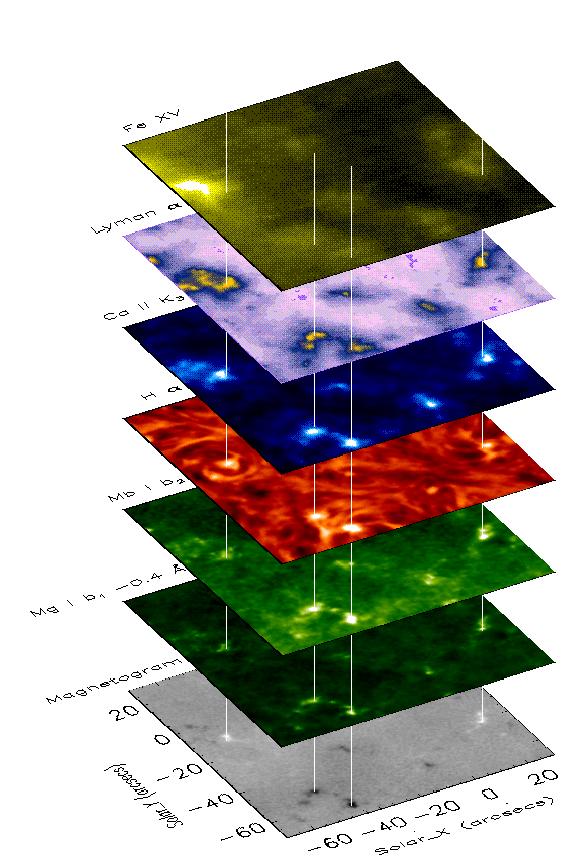
A 150-minute sequence of 100 x 100 images were obtained in all wavelengths, centred on a quiet Sun field (Solar_X = -25, Solar_Y = -35) with a 45 s cadence. This provided seven NBPs (Figure 5.1), four of which (NBPs 1, 2, 5 & 7) were distinguishable throughout the entire series in all wavelengths, and hence are used here. As discussed in Chapter 3 the UBF cycle (Table 5.1) also included two Fe I (6302.5 Å) images, linearly polarised at to each other. These images were destretched, integrated and combined to create the magnetogram at the bottom of Figure 5.1. Coalignment of the ground based images with the TRACE data led to a calculated spatial size of 0.33 per pixel in the Ca II K3 data and 0.18 per pixel for the other wavelengths (Table 5.1). Figure 5.1 shows that the chromospheric NBPs have a one-to-one spatial correlation with the photospheric magnetic field and exist throughout the transition region, and even into the corona.
Analysis of the DST observations was carried out using standard routines within SSW. The data were corrected for CCD readout bias and flat-fielded. Each image was aligned to the first image of the series by means of cross-correlation. TRACE images were reduced using the standard calibration and despiking routines provided. Light curves in each wavelength were then created using the contour and contrast method, high-pass filtered and subjected to a Fourier analysis as described in Chapter 4.