 |
 |
An estimation of the height of formation of each bandpass is provided in Table 5.1. It is important to note both the difficulty of estimating these, and their physical meaning. Essentially the temperature and density of the plasma where the optical depth of light emitted in each bandpass is unity (τ = 1), photons escape from the solar atmosphere without any further absorption) is estimated. These parameters are then compared to models of the chromosphere in order to assign a height of formation. However this τ = 1 surface will vary dramatically according to the local plasma parameters. This, combined with the fact that most models are of a magnetic-field free plasma, means that care must be taken not to apply too much physical meaning to any height of formation estimation.
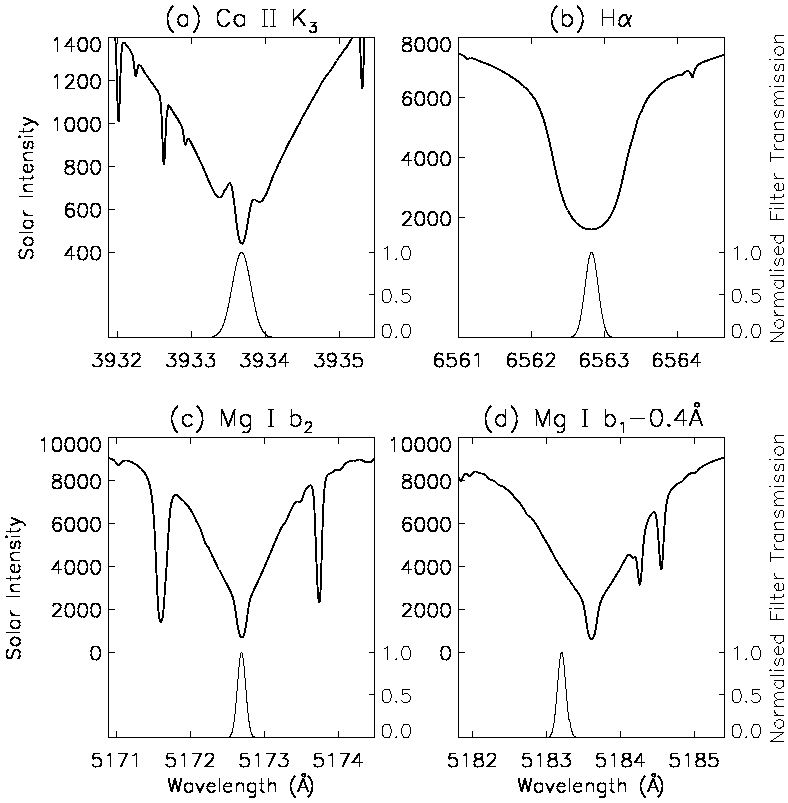
Figure 5.2 shows the profile of each filter overplotted on the line profile of the respective wavelength. As the Ca II K3 profile is narrowband, most of the emission is assumed to be from the K3 core. However there will be some contribution from the self-reversed K2 peaks. The VAL model is used here to estimate a height of 1800-2000 km. The height of formation of the Hα core is also estimated from the VAL model. It is well known that Hα contains a double-peaked response function, so a much larger range of heights is assumed (1200-1700 km). The Mg I b2 core is discussed in Kneer & von Uexküll (1993) who, with a bandpass of 0.6 Å, place it at ~350 km. However, the data presented in this paper have a much smaller bandpass, and as such include less of the wings, so are placed at 700-750 km (Schmieder 1979). Keller & Koutchmy (1991) use data 0.4 Å into the red wing of the Mg I b1 line, and adopt 200 km as the height of formation. Although our data are 0.4 Å in the blue wing, we also adopt this height of formation.
Compared to the relatively clean images of Ca II K3, Mg I b2 and Mg I b1-0.4 Å, the Hα images are notoriously difficult to study due to the presence of extra structure (Chapter 1 of this thesis; Zirin 1966). Hence extra care was taken to correctly identify each NBP. The contour method was particularly useful for these data as it ensured non-NBP brightenings were not included.