 |
 |
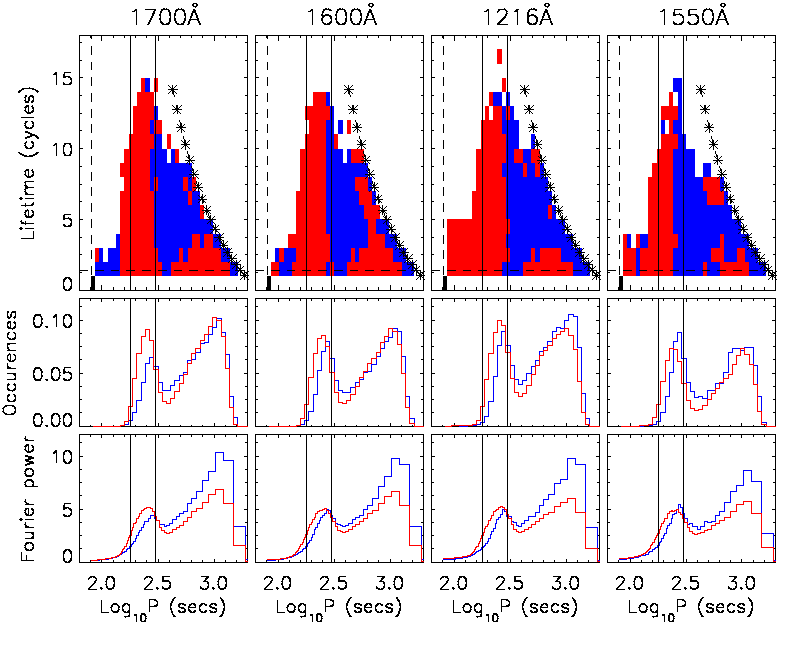
Krijger et al. (2001) show that the network oscillatory power exceeds that in the internetwork for all frequencies below ~5 mHz (their Figure 12). The time-localised nature of wavelet analysis can be used to extend this type of study into the temporal domain. In each bandpass, an average network and internetwork lifetime-period diagram was created (i.e., an average of block A and block B, except in 1550 Å where only block A data was used - Section 6.4.5). A comparison diagram was then created by comparing the network occurrence rates to the internetwork occurrence rates at each period and lifetime. Figure 6.8 shows the resulting network / internetwork comparison for all datasets. In each column, the top part has the same axes and lines as Figure 6.4 (also Figure 6.6). Blue parts of the top row of Figure 6.8 refer to where the network has a greater occurrence rate, whereas red parts refer to where the internetwork dominates. The middle and bottom row of Figure 6.8 are directly comparable to Figures 6.5 and 6.7. In these plots, the blue lines refers to network data, and the red lines to internetwork. It is clear from the middle and bottom rows that the network has greater oscillatory power at all periods longer than log10(P) = 2.45 (P ~ 280 s; 3.6 mHz). There is also a tendency for this cross-over period to decrease with increasing HOF (from ~300 s in 1700 Å to ~250 s in 1550 Å). However the top row in Figure 6.8 displays a further feature. If the network dominates for all lifetimes at periods above log10(P) = 2.45, then the resulting plots in the top row should be entirely blue to the right of this cross-over, and entirely red to the left of this cross-over. Instead there are regions of internetwork domination above log10(P) = 2.45 for a small number of cycles. This mixing is more prevalent in the 1700 Å and 1600 Å data than for the 1216 Å and 1550 Å, suggesting these short-lifetime, long-period internetwork oscillations are most likely a low-chromosphere phenomenon. There is also some mixing at short periods, which may be examined further by using a higher-cadence dataset.