 |
 |
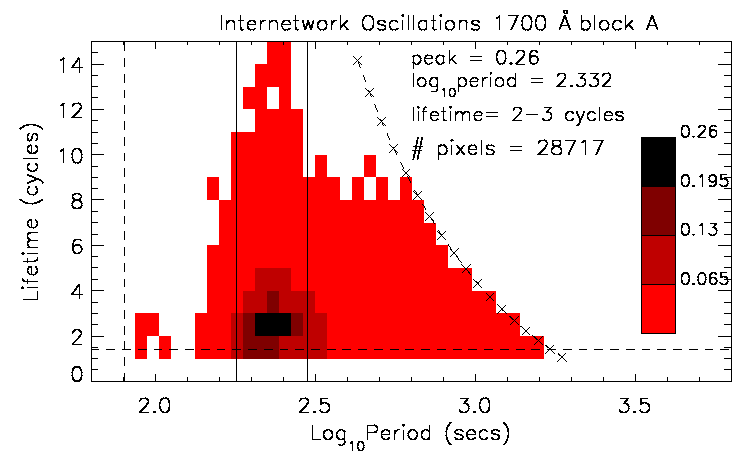
A summary of all internetwork oscillations for the first half (block A) of the 1700 Å data is shown in Figure 6.4. Here the ordinate is the period, P, as determined from the wavelet analysis. The nature of wavelet analysis means that the values of period increase logarithmically. The abscissa, l, is the oscillation lifetime binned to integer values. For example, the lifetime of 4.67 cycles discussed above is placed in the 4-5 bin. The horizontal dashed line is at (√2)/1.03 cycles (minimum lifetime), the vertical dashed line is at the Nyquist frequency, while the two solid vertical lines are at 3 and 5 min. The curved dashed line refers to the maximum number of complete cycles which can be observed at each period (due to the finite length of the time series). Figure 6.4 is plotted on a inverted linear intensity scale, such that darker areas correspond to a larger number of pixels with oscillations at period P, for lifetime l. The four colour bands refer to the upper quartile (black; >75% of peak value), mid-upper quartile (dark red; 50-75% of peak value), mid-lower quartile (brighter red; 25-50% of peak value) and lower quartile (bright red; <25% of peak value). The data have been divided by the number of pixels (hence number of light curves), to make all results from the network and internetwork directly comparable. It should be noted that oscillations in the bright red areas are not less significant than those in the black areas - the rules regarding significance are the same for all oscillations. Instead, oscillations in the bright red areas are less common than those in the black areas. This is an important distinction between the wavelet studies and the results from Fourier analysis.
Figure 6.4 displays several interesting features. The most common oscillation is a well defined peak with a period of log10(P) = 2.33 (P ~ 210 s), lasting for 2-3 cycles, with an occurrence rate of 0.26 (i.e., 1 in 4 pixels contain an oscillation at this period for this lifetime). There are few oscillations below log10(P) = 2.2 (P ~ 160 s), and all the long-lifetime oscillations (LLOs; defined as >8 cycles) occur near the acoustic band (i.e., log10P ~ 2.2-2.5). The internetwork results from the other UV passbands display a similar behaviour.
 |
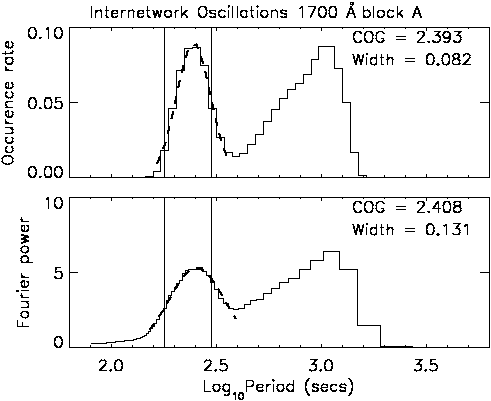
By summing Figure 6.4 over the lifetime axis we can create occurrence rate curves which are directly comparable to the average Fourier power curves (Figure 6.5). These occurrence rate curves have also been divided by a probability correction curve, to account for the fact that short-period oscillations are more likely to be observed (less time to undergo (√2)/1.03 cycles, and more light curve outside the COI). In Figure 6.5 the ordinate is the occurrence per pixel (i.e., average number of cycles) for the top panel, and average Fourier power per pixel for the bottom panel. Both panels share the same abscissa as Figure 6.4, namely period on a log scale. Again the two vertical lines are at 3 and 5 min.
Although the curves in Figure 6.4 are comparable, the distinct Fourier - wavelet difference still exists. In the top part of Figure 6.4 all the oscillations are equally significant - all oscillations have a >95% significance for at least t = td. However in the bottom part, the Fourier power defines the significance. As these are normalised Fourier power spectra, the 95% significance level is at 5.99 (see Chapter 4). Hence although the oscillations with log10(P) = 2.6 are all above 95% significance in the wavelet study, their average Fourier power is well below 95%.
A simple Gaussian fit (i.e., with no continuum) has been applied to the feature around the acoustic band and overplotted in each case. The Gaussian fit was applied to the region of the curve from where it rises above zero, to the minimum around log10(P) = 2.6. The value of the centre of the Gaussian fit (COG), and one sigma width are displayed in the top right corner of each plot. It should be noted that this width is an indication of the spread of frequencies around the peak. The estimated error in the determination of the position of the centre of the Gaussian is typically around 0.005 in log10(P) (i.e., δP 4> s), and hence much smaller than the one sigma width.
Figure 6.5 shows the good agreement between the wavelet analysis and classical Fourier approach. It displays a rise of power (Fourier) and occurrence rate (wavelet) with increasing period, reaching a maximum around log10(P) = 2.4 (P ~ 250 s). This value differs from the peak in Figure 6.4 because of the probability correction curve applied to the data. Both curves reach a minimum around log10(P) = 2.6 (P ~ 400 s), followed by a gradual increase at higher periods. Using phase analysis techniques, Krijger et al. (2001) attribute this high period power primarily to internal gravity waves, with some contribution from granular overshoot and the low-frequency tail of acoustic interference. The fall-off at log10(p) >3.0 is due to the high-pass filter applied to the light curves.