 |
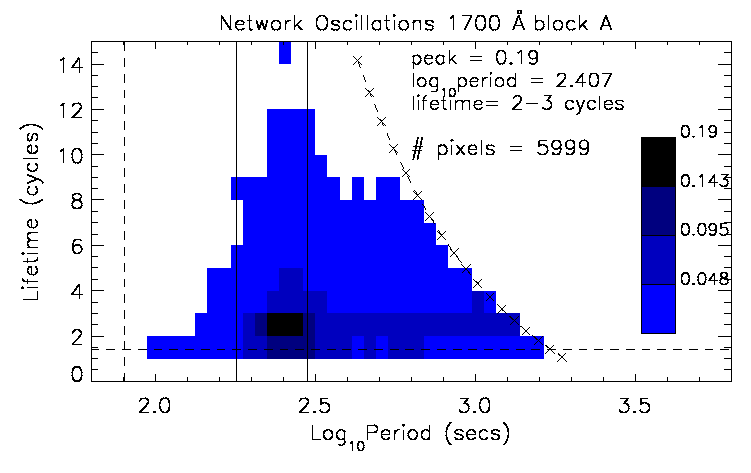
A summary of all network pixel oscillations from the first half of the 1700 Å data is displayed in Figure 6.6. In contrast to the results from the internetwork pixels, the most common network oscillation is a well defined peak with a longer period of log10(P) = 2.41 (P ~ 260 s), lasting for 2-3 cycles, with a lower occurrence rate of 0.19 (i.e., 1 in 5 pixels contain an oscillation at this period for this lifetime; the distribution of the occurrence rate is broader in the network). As in the internetwork, there are few oscillations below log10(P) = 2.2 (P ~ 160 s), and all the LLOs occur near the acoustic band. However, the network contains an extended tail at the 25-50% level up to periods of log10(P) = 2.9 (P ~ 800 s). Hasan & Kalkofen (1999) suggest a scenario whereby kink-mode waves generated in the photospheric network may travel up through the chromosphere, before coupling with saugage-mode waves. The extended tail of the network oscillations in Figure 6.6 may be the oscillatory signature of the kink-mode wave at P = 534 s (log10(P) = 2.73). In the 1216 Å and 1550 Å passbands this tail is less evident, hence these waves may have coupled in the high chromosphere.
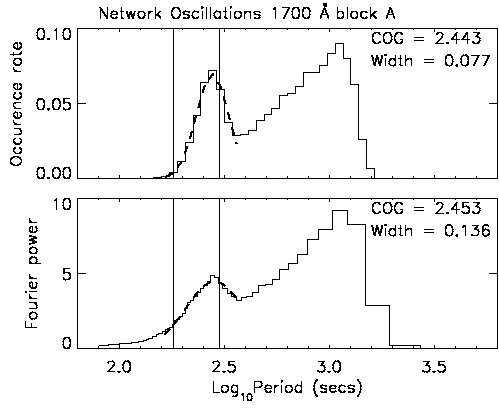 |
Figure 6.7 repeats the comparison of the wavelet analysis and classical Fourier approaches of Figure 6.5, but applied to the network data. Figure 6.7 displays a rise of power (Fourier) and occurrence rate (wavelet) with increasing period, reaching a maximum around log10(P) = 2.45 (P ~ 280 s). The two curves reach a minimum around log10(P) = 2.6 (P ~ 400 s), followed by a gradual increase. Again the fall-off at log10(p) >3.0 is due to the high-pass filter performed on the light curves.