 |
| Date | 1999 May 04 |
| Image Size (px) | 256 x 640 |
| Image Size (") | 128 x 320 |
| Time (UT) | 08:08 - 11:52 |
| 1700Å exposure (s) | 2.0479 |
| 1600Å exposure (s) | 1.0239 |
| 1216Å exposure (s) | 2.1538 |
| 1550Å exposure (s) | 5.7919 |
| Effective cadence (s) | 40.05 |
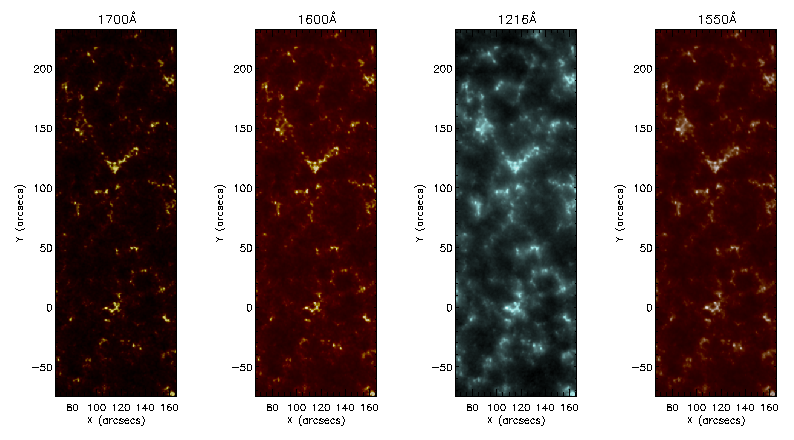
A dataset from 1999 May 4 containing quiet-Sun images in the four UV passbands (1700 Å, 1600 Å, 1216 Å, 1550 Å) with a FOV of 128 x 320 was selected for this study. Further details of the dataset can be found in Table 6.1, and example time-average images are displayed in Figure 6.1. A simple investigation into the frame rate stability in each passband resulted in a constant cadence of 40.05 s being assumed for the purpose of both Fourier and wavelet analyses. After image 168 there was a 50 s delay, corresponding to a small change in the FOV as TRACE compensated for solar rotation. For this reason the data were divided into two equal timeblocks; block A containing images 1-168 and block B containing images 169-336. This creation of two data blocks was also vital for data analysis (Sections 6.3.1 and 6.3.2) and to the search for oscillation recurrence (Section 6.4.3). In some cases there were 80 s time gaps between images. It was assumed this was due to a missing image. These missing images were replaced by an average of the (aligned) preceding and following images. Any images severely contaminated by cosmic rays were cleaned using programs available in the TRACE branch of SSW.
 |