 |
 |
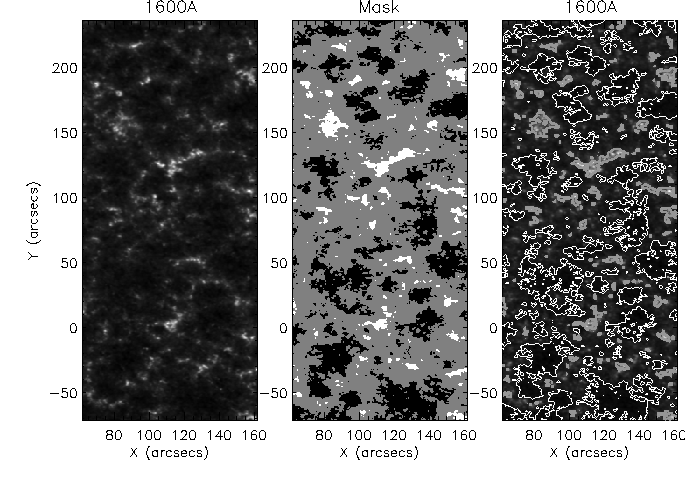
The nature of the network to appear bright in time-averaged images is used to define a network/internetwork mask in a method similar to Krijger et al. (2001). For the aligned 1600 Å data, a time-averaged image was created for each block. For each time-averaged image, a histogram of pixel values was created. Pixels with an intensity below the modal intensity value were defined as internetwork, while those with an intensity value greater than one standard deviation above the mean intensity value were defined as network (Chapter 4 this thesis; Worden et al. 1999). The subsequent network pixel arrays for block A and block B were compared, and only pixels defined as network in both datablocks were retained. A similar process was carried out for the internetwork. The resulting network and internetwork pixels are displayed in Figure 6.2. The leftmost image is the time-averaged 1600 Å block A, where the network appears as bright clusters at supergranular cell vertices. The network and internetwork pixels are contoured in the rightmost image, according to the masks in the middle image (where white is the network mask and black is internetwork mask). These masks were then applied to all the data, resulting in 28717 internetwork light curves, and 5999 network light curves in each of the four UV passbands.