 |
 |
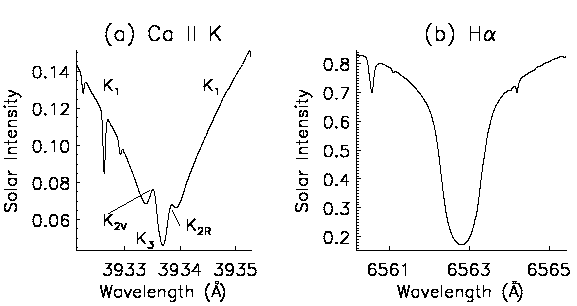
Although this simple explanation works well for weak and medium strength lines, as well as for the wings of stronger lines, the cores of the stronger lines must be explained differently. These lines are formed above the temperature minimum in the mid and high chromosphere (Figure 1.4). At these increased temperatures, the local temperature, describing the speeds of atoms and ions, can be several hundred degrees higher than the the radiation temperature. Hence the source function cannot be equated to the Planck function and the LTE approximation cannot be assumed. Lines here fall into one of two categories, either photoelectrically or collisionally controlled. The Balmer H line is a good example of a photoelectrically controlled line. As such, the H line strength is dominated by photon excitations, and hence is governed by radiation from the photosphere, rather than the local temperature. Moving out from the photosphere, the source function steadily decreases, resulting from the increasing amount of radiation escaping into space (and hence decreasing emission coefficient). The line profile of H (Figure 1.5b) is purely in absorption at line centre (formed around 1500 km) and moving away from line centre corresponds to moving down through the atmosphere, where the emission coefficient, and hence source function, is higher. The ionized calcium (Ca II) H and K lines are good examples of collisionally controlled lines. Here the line is dominated by electron collisions with the atom and hence reflects the local temperature. As the temperature increases moving out through the chromosphere, the source function also increases (due to increased emission). Around a height of 1900 km the source function decreases again, due to scattering. Hence the line core, denoted K3, is formed at 1900 km, the self reversed peaks on either side (K2) are mid-chromosphere, and the line wings (K1) are formed around the temperature minimum (Figure 1.5a).