 |
 |
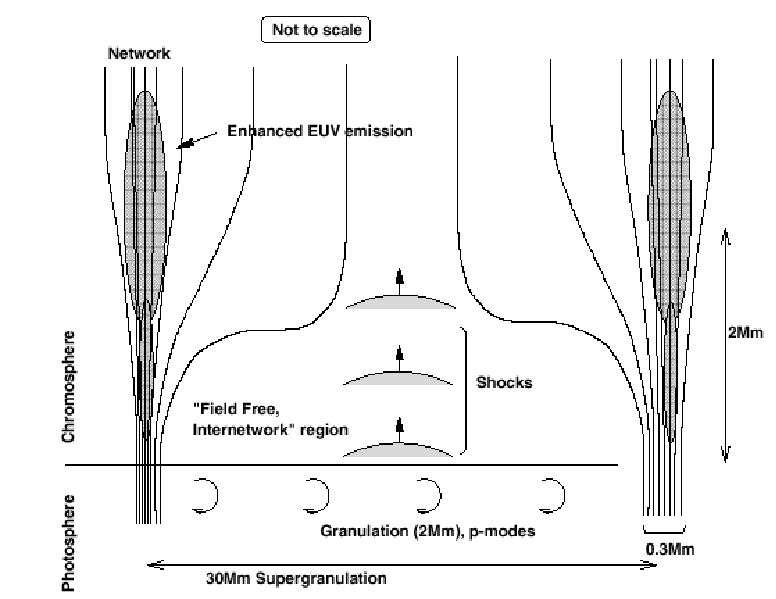
Magnetic fields exist throughout the solar atmosphere and can be imaged and measured using the Zeeman splitting of Fraunhofer lines. The Zeeman splitting comes from the interaction of the external field with the magnetic field created by the electron motion, resulting in a small positive or negative energy transfer to the photons emitted. As such, a single Fraunhofer line is split into two components, with the separation proportional to the field strength (discussed further in Chapter 3). Iron is the most popular choice for magnetograms, imaging the photospheric magnetic field, but other Fraunhofer lines can also be used to image magnetic fields throughout the solar atmosphere. The splitting increases linearly with wavelength, giving obvious benefits from imaging in the red and infrared wavelengths. Solar magnetic fields are most conspicuous as sunspots in white light images, but smaller scale magnetic features can also be viewed in the wings of H or line centre of the G-band (the molecular band head of the CH molecule). Typically sunspots have a field strength of 3000 G, and the smaller structures around 1000 G. These structures are in pressure balance with the surrounding environment, therefore the gas pressure inside must be smaller than the surrounding atmosphere, as the magnetic field exerts an additional pressure. Hence the structures are confined by the surrounding gas pressure and the photosphere is locally depressed within. For sunspots this is viewed as the Wilson depression. To compensate for the reduced gas pressure in the upper atmosphere the magnetic structures fan out (Figure 1.6). Eventually around the high chromosphere neighbouring structures meet, and the entire atmosphere is magnetic (Kopp & Kuperus 1968). Recent work by Schrijver & Title (2003) question the validity of this type of canopy. They suggest an alternative whereby field lines from the network connect with weaker fields in the nearby internetwork.