 |
 |
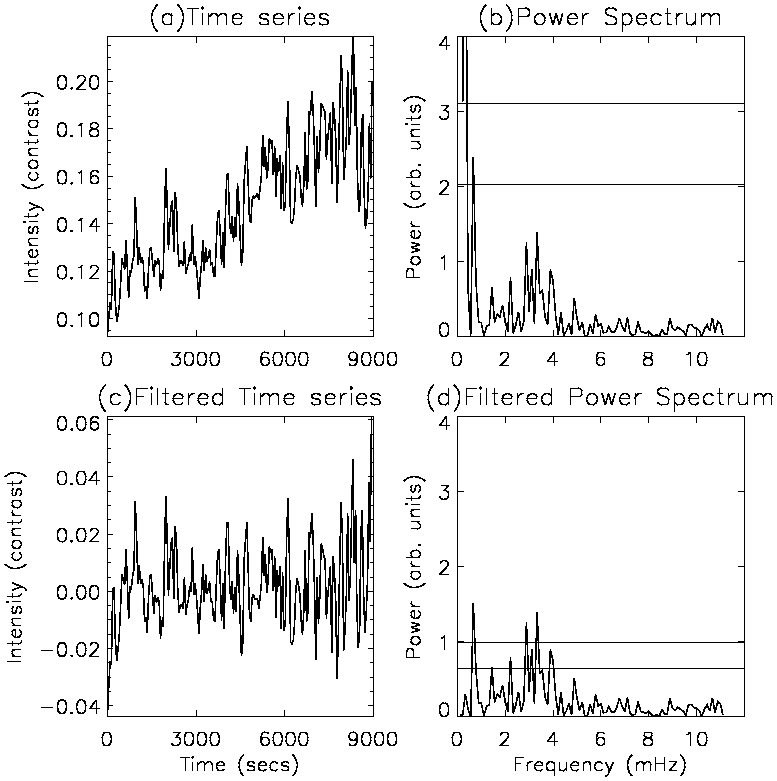
If the original continuous signal contains oscillatory power at frequencies greater than the Nyquist frequency (i.e., signal is under-sampled), aliasing may occur. Aliasing results in power at these higher frequencies showing up as power at low frequencies in the resulting power spectrum. Hence the first few components of the power spectrum may contain a lot of false power swamping any real peaks in the power spectrum. Figure 4.4 shows the effect of filtering a lightcurve to remove power at low frequencies. The top row contains the original lightcurve and resulting power spectrum. The slowly varying nature of the lightcurve results in the large peaks at < 1 mHz. The bottom row displays the filtered lightcurve and resulting power spectrum. As a result of removing the slowly varying component, the standard deviation of the lightcurve is lower, decreasing the 99% and 95% siginificance levels (Eq. 74). Hence the peaks at around 3 mHz become 99% significant.
It is vital to remove these low frequencies without introducing erroneous effects. The most common methods of filtering are applied in the time domain (i.e., simply subtract the trend from the lightcurve, or perform a running average.) However these methods can change the overall shape of the lightcurve. It is statistically preferable to carry out the filtering in the frequency domain by convolving the lightcurve with a suitable Bessel function. The convolution theorem states that the Fourier transform of a convolution is simply given by the product of the individual transforms, i.e., for a convolution, h(t), of two signals, f(t), and g(t), which have Fourier transforms, H(ν), F(ν), and G(ν), respectively,
| (75) |
| (76) |
 |
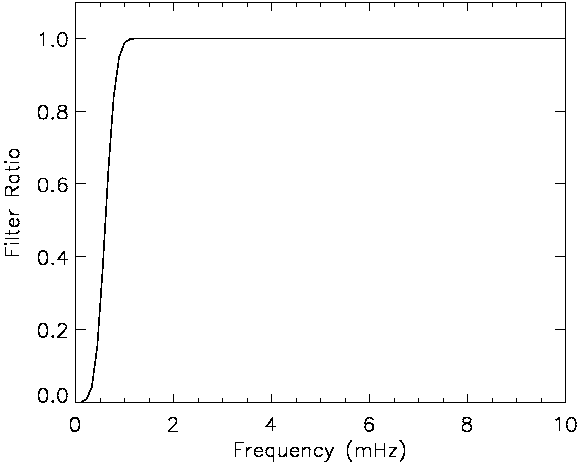
For the data presented here, the filter profile (Figure 4.5) was chosen as to have no effect on frequencies above 1.5 mHz, and only reduce the power at 1.0 mHz to 90% of the unfiltered lightcurve. As well as aliasing, other factors of non-solar origin (e.g., atmospheric effects, edge effects) are also strong in this low frequency region.
There are two other important effects which need to be considered when using the DFT, namely spectral leakage and the picket-fence effect. Spectral leakage is a spreading, or leaking, of spectral components away from the correct frequency. This is a direct result of the finite length of the signal and hence the length is never an exact integral number of any periodicity which may be present. This leads directly into the picket fence effect whereby the actual Fourier peak may lie between two values of νj. This effect can be reduced by padding the input signal with zeros, hence increasing the length of the signal and shifting the values of νj. This shift may discover spectral components which were initially hidden. In the analysis of this dataset we incorporate an error value in each peak of ±δν (the frequency resolution). Hence a peak at νj = aHz refers to power in the range (a-δν) - (a+δν) Hz. This reduces the combined effects of spectral leakage and the picket-fence effect.