 |
 |
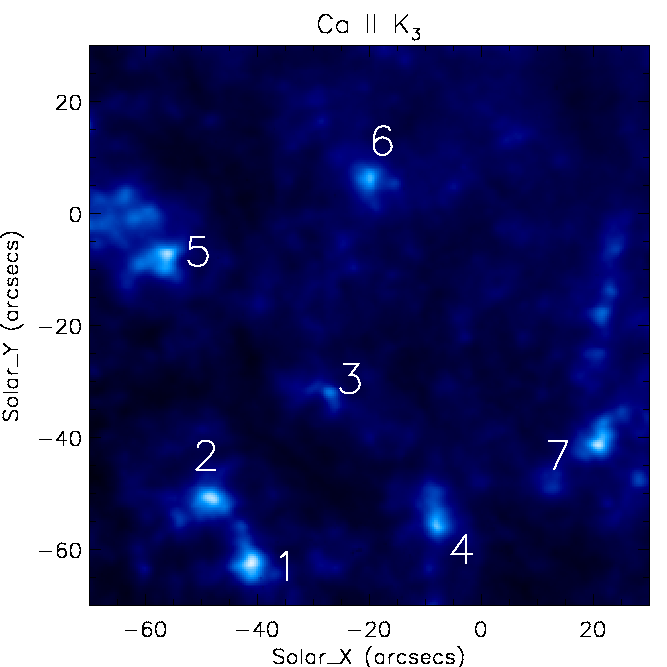
Seven NBPs were clearly identified (Figure 4.1) which exist throughout the entire dataset and sub-fields of 30" x 30" centred on each NBP were extracted. This created seven 3-dimensional data cubes (two spatial and one temporal dimension) which were then analysed using custom-written programs in SolarSoftWare IDL (SSWIDL; Freeland & Handy 1998).
For each NBP subset, contours were drawn on each image in the sequence at a chosen intensity threshold value. This contouring ensures that each NBP is followed carefully over time (after Cauzzi et al. 2000). It also provides a means of separating the NBP brightenings from the internetwork contribution. Integrating over entire pixel subfields will include signal from both solar (internetwork) and non-solar (sky fluctuations) oscillatory components. Here we add a further improvement to the contour method of Cauzzi et al. (2000), that allows us to better isolate each individual NBP. A routine was used to ensure only pixels within a closed contour around the NBP were used. This ensures that erroneous pixels - due to sudden fluctuations in the background, supergranular lane flow or other NBPs - are ignored.