| Single-latitude cuts were made at 18 Jovian locations: |
|
grs_bright_n | grs_bright_s grs_center grs_dark_sw grs_mid_ne grs_mid_nw grs_mid_se grs_mid_sw a.k.a. the Little Red Spot (LRS)
lrs_bright_w | lrs_center lrs_dark_w lrs_mid_w
trs_bright_n | trs_center trs_dark_sw
sez
|
neb
| (This one did not converge in any of the models. It is not included in the plots that follow.)
seb
| |
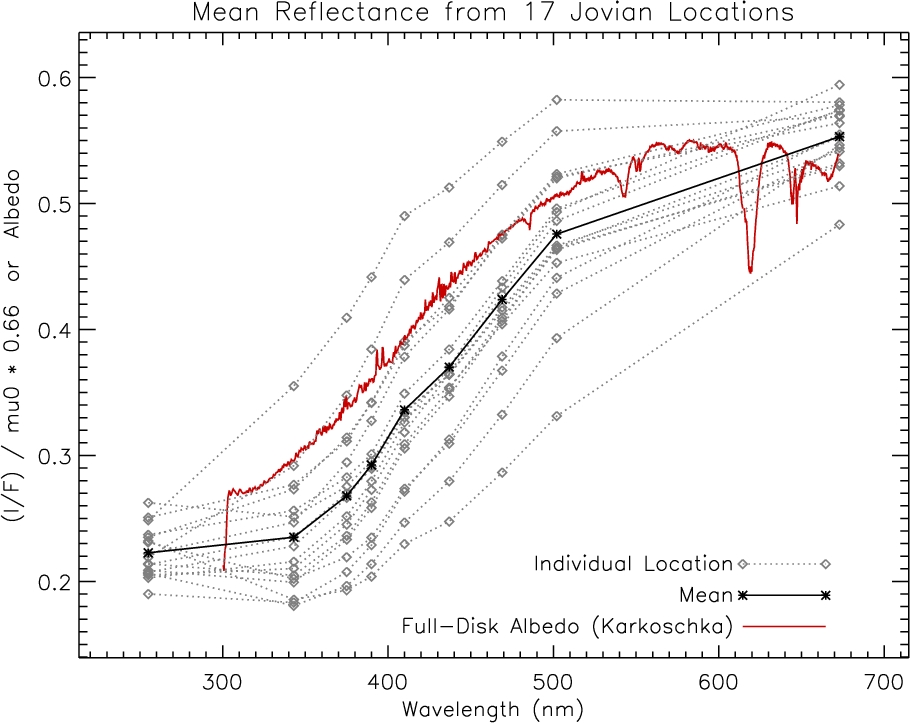
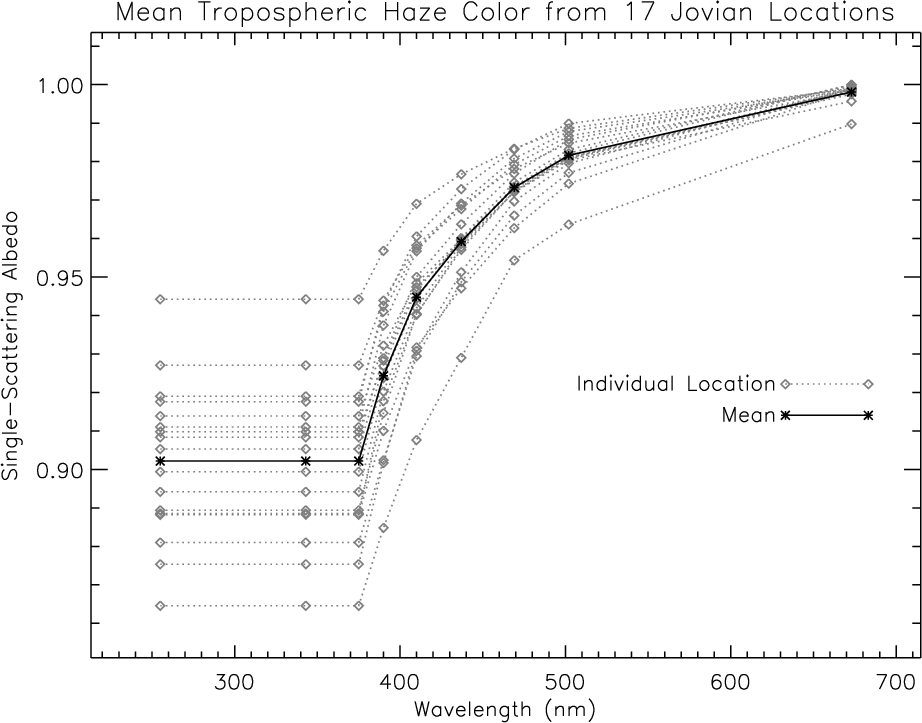
The single-scattering albedo (SSA) values reported here are averages of the tropospheric haze SSA from models with chi^2 less than 1.0. Notice that SSA(255 nm) and SSA(343 nm) are fixed at the value of SSA(375 nm) in the tropospheric haze.
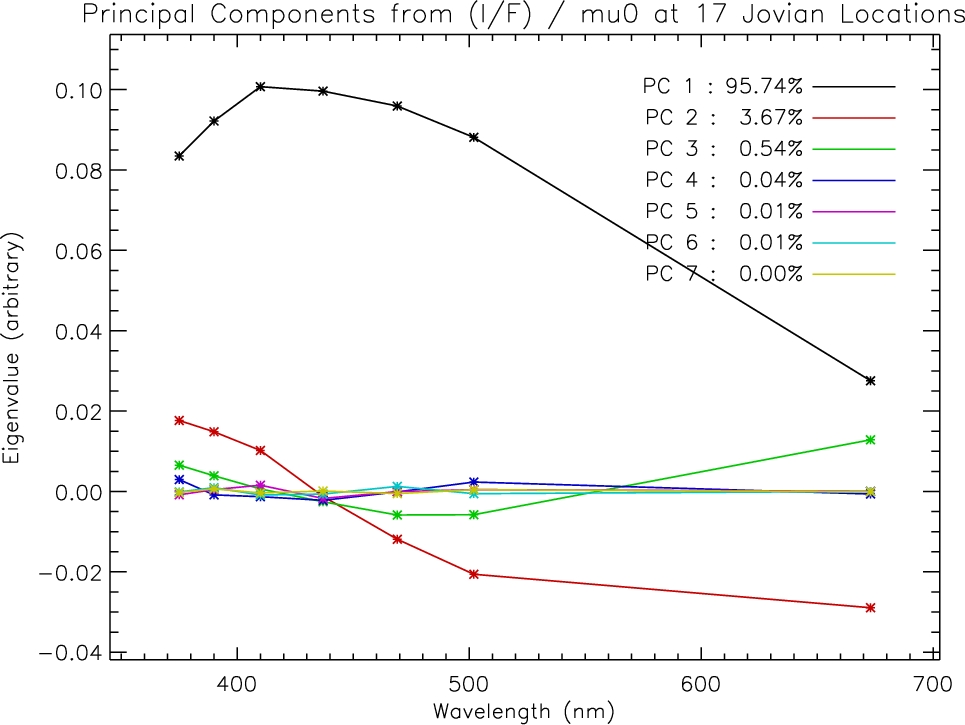
PCA of I/F spectra for all filters where SSA is free to vary in the models (i.e., all but 255 nm and 343 nm).
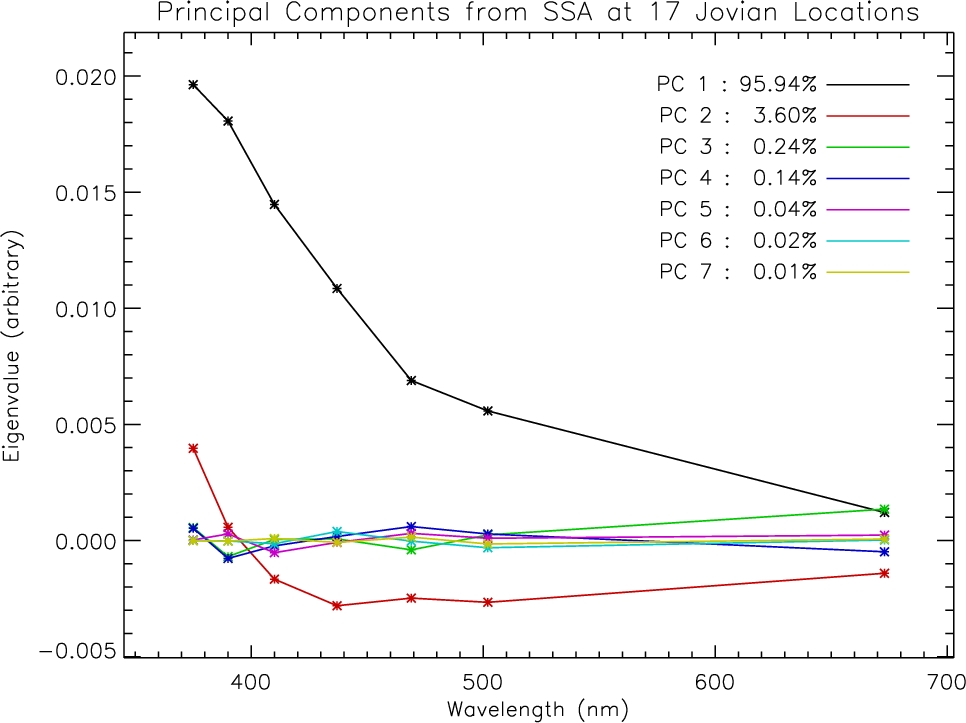
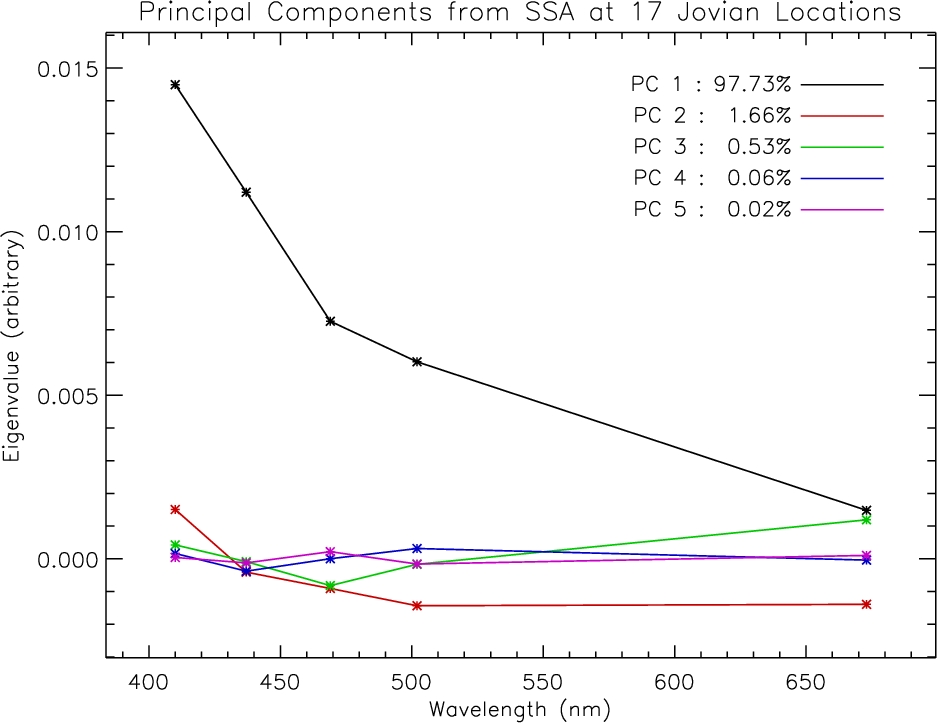
PCA of SSA spectra for all filters where SSA is free to vary in the models (i.e., all but 255 nm and 343 nm).
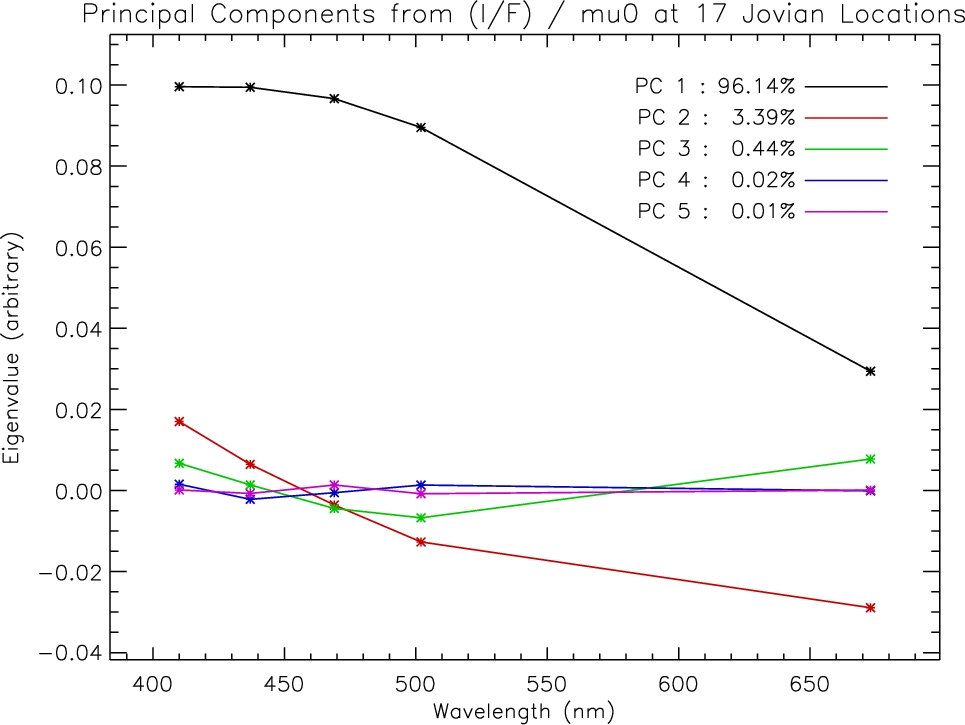
PCA of I/F spectra for all filters redward of 400 nm.
PCA of SSA spectra for all filters redward of 400 nm. |