|
The visible surface of the Sun is a thin layer of plasma known as the photosphere, denotes the top of the solar interior (Figure 1.3) and is the depth limit of direct observations. As such the photosphere is best defined using optical depth,
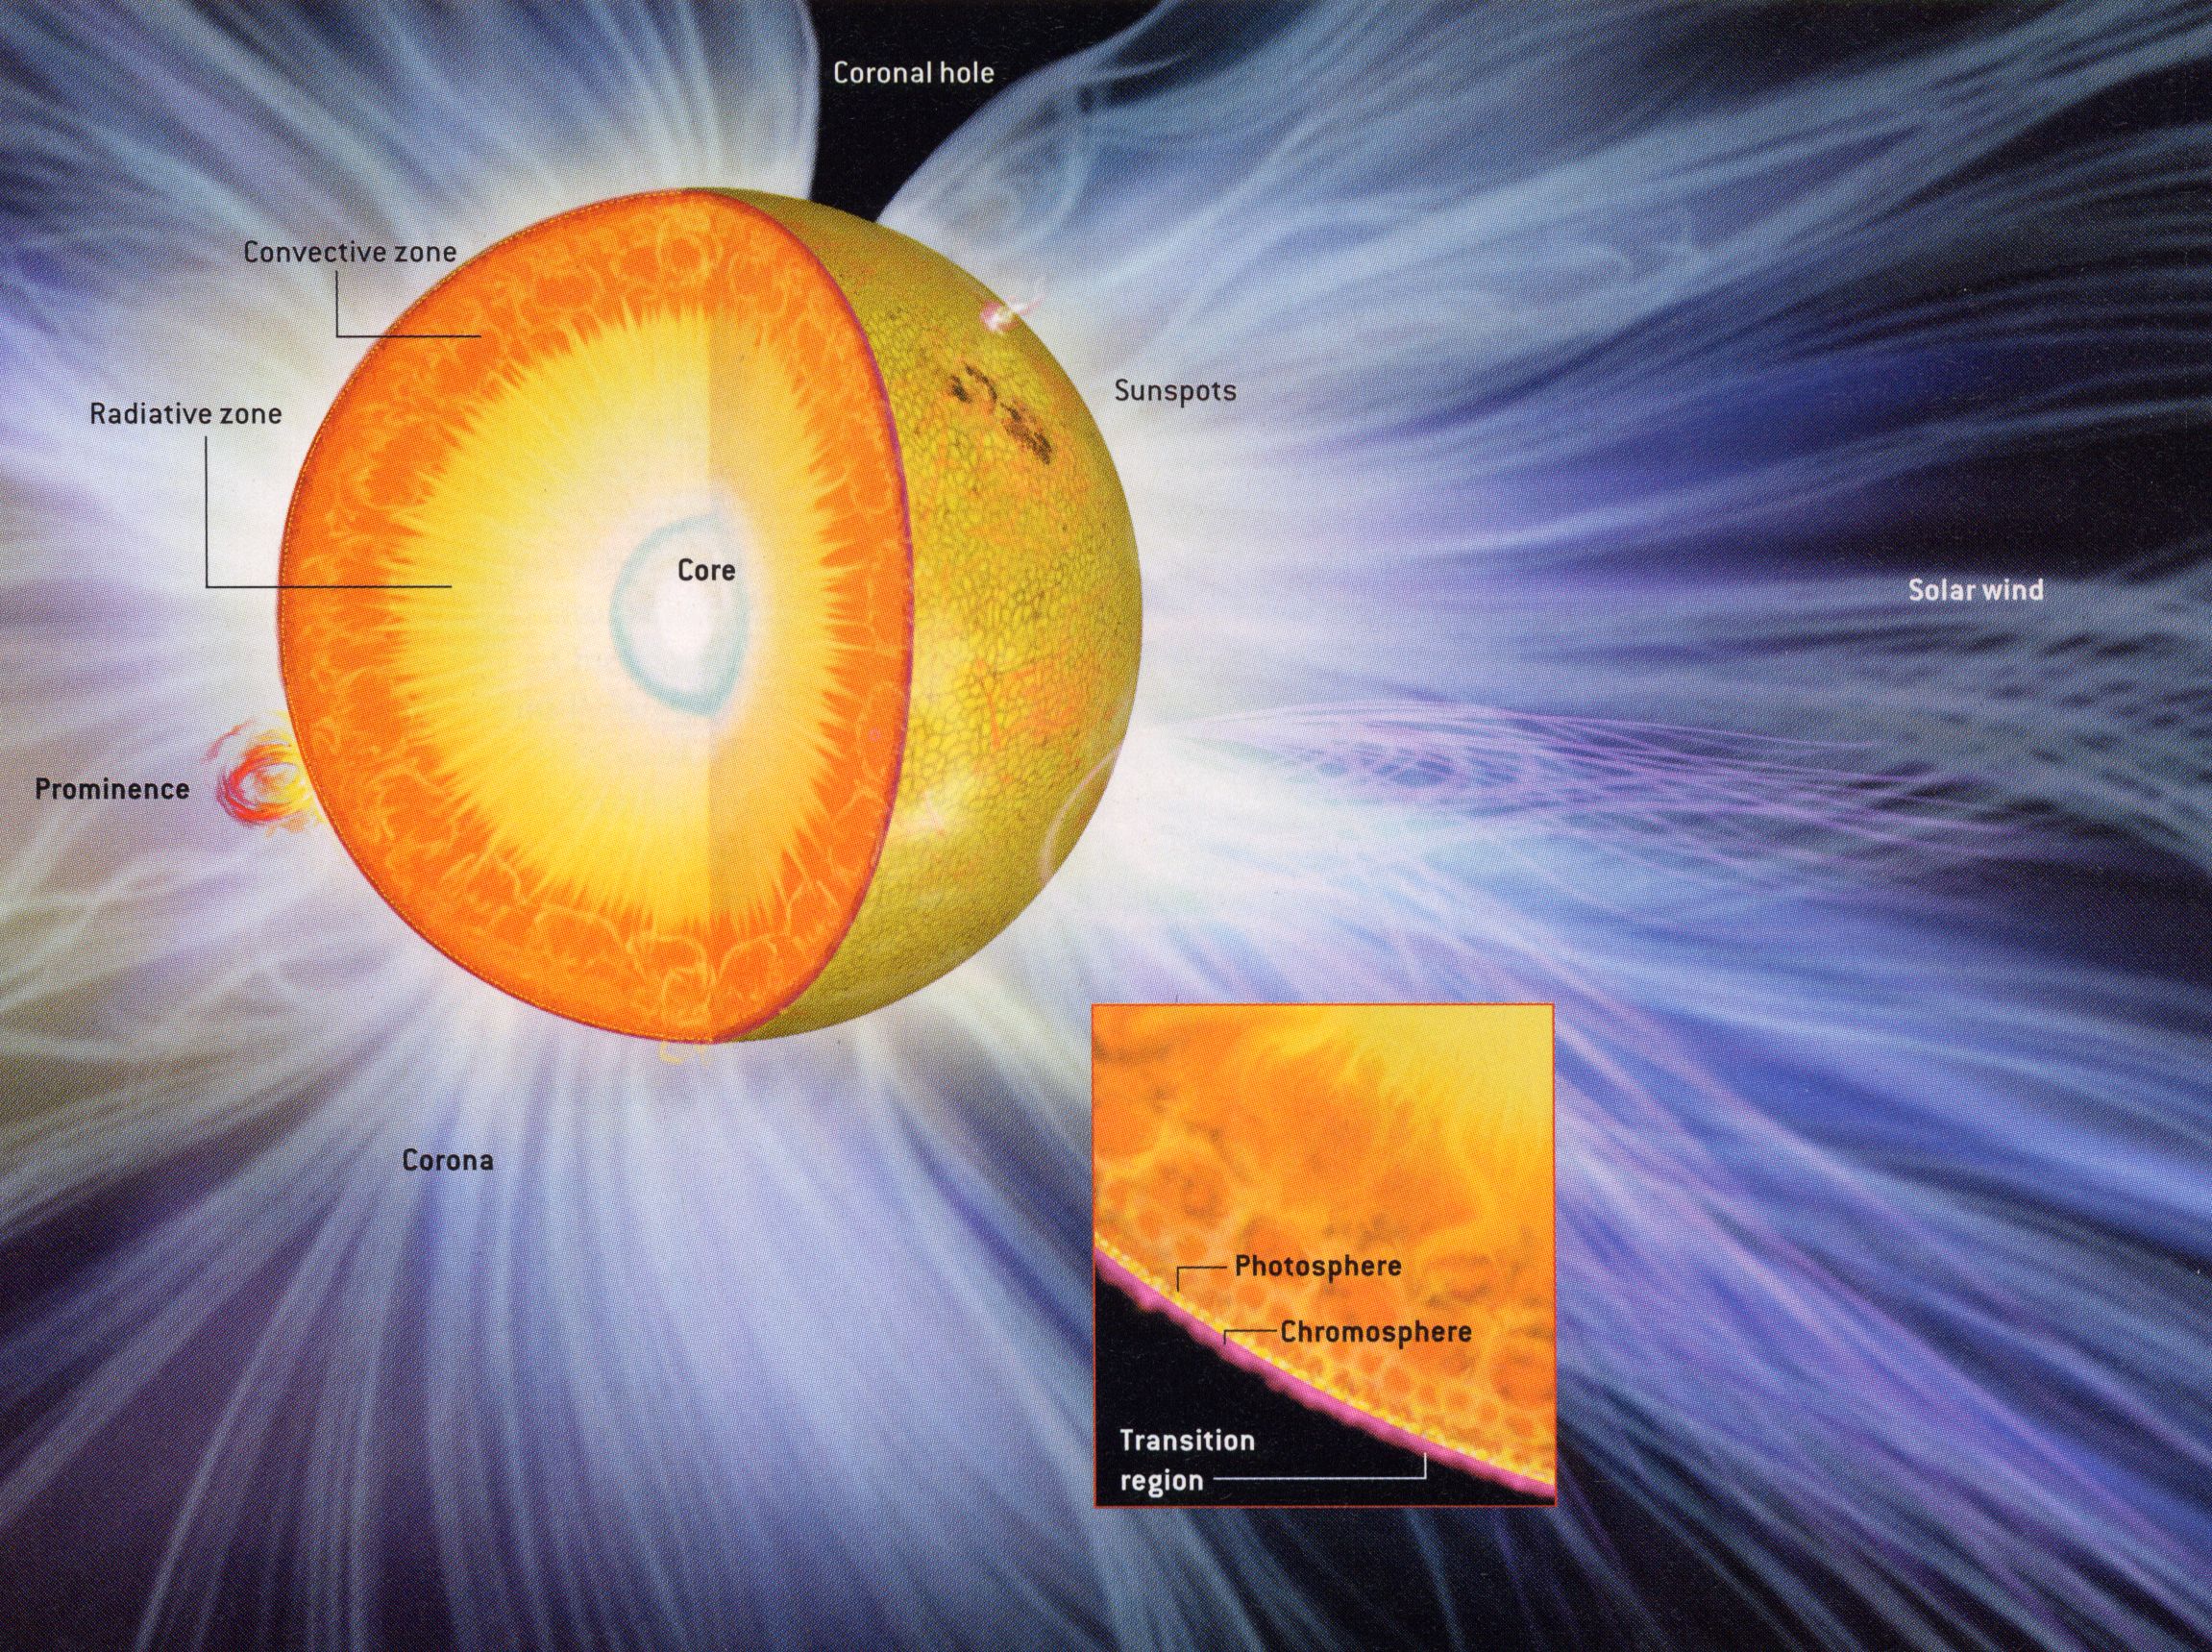
 outside the Sun. The optical depth is essentially the number of mean free paths along the line of sight. For a large τ, photons are absorbed and re-emitted numerous times along the line of sight, and so the plasma is described as optically thick. This applies to the deep lying layers of the Sun. Photons originating in the core pass through the radiative and convective zones, with the respective transport mechanism dominating in each zone, before reaching the photosphere (Figure 1.3). The photosphere has a small τ, so most photons can travel directly to earth without being absorbed. The common definition of the photosphere is the layer from which the bulk of the visible photons are emitted,
 . As optical depth is a function of wavelength, it is reasonable to refer to the visible photosphere, the infrared-red photosphere, et cetera. Hence for the Sun, where the majority of photons are emitted in the visible wavelength, the photosphere is often defined as the layer where light emitted at 5000 Å (green) has an optical depth of 2/3,
 ). The optical opacity of the photosphere and upper solar interior is mainly due to the negative hydrogen ion, where the second electron is only loosely attached. A photon with a large range of energies can hence remove the electron by absorption.
Above the photosphere the conditions change rapidly (Figure 1.4). Moving up through the chromosphere the electron density drops off, while the temperature drops to a minimum of 4200 K then gradually increases again. At a height of about 2000 km above the photosphere the electron density decreases sharply, and temperature increases dramatically from 25,000 K to a coronal temperature of 106K in a transition region only a few hundred kilometers thick. This layer acts as an interface between the cool chromosphere and the hot tenuous corona. The corona, only viewable from earth when the photosphere is blocked out by a total eclipse or coronagraph, extends out though the solar system past Earth and on to the gas giants.
By careful comparison of atomic data with modelling of the solar atmosphere it is possible to estimate the height of formation of the Fraunhofer lines (Figure 1.4). The VAL model (Vernazza, Avrett, & Loeser 1981) is the most widely used and complete model of the origin of the absorption lines. This model is derived by semi-empirically inverting the observed extreme ultraviolet (EUV) line intensities. The cores of the stronger lines (Balmer lines, ionized calcium and magnesium) form mostly in the chromosphere, whereas weaker lines (e.g., G-band) originate from the low chromosphere/photosphere. The transition region mostly emits in ultraviolet (UV) wavelengths below 2000 Å, which is strongly absorbed by the earth's atmosphere. The corona has increased UV, EUV and X-ray emission due to its high temperature. However the corona also emits a pair of visible continua, the K and F coronae. The low-intensity K corona, which dominates nearer the Sun, is due to electron scattered light. Doppler broadening due to the fast motion of the electrons removes the Fraunhofer lines from this continuum and polarizes the light. These scattering electrons must have extremely high temperatures (∼2 X 10⁶k). The F corona comes from light scattered by dust particles and does contain the Fraunhofer lines. Several optical lines which could not be attributed to any element known on earth were detected in the eclipse of 1869. They were attributed to a new element, `coronium'.The brightest lines were the green line (5303 Å) and the red line (6374 Å), with a few dozen fainter lines also discovered. The actual source of these was finally explained by Edlin (1942) and Grotian (1939) as due to forbidden transitions in highly ionized iron (Fe XIV and Fe X respectively). The high temperatures necessary to create these ionisation states, and the low densities to ensure the forbidden transition from the metastable states, provided further evidence of the extraordinary conditions in the corona.