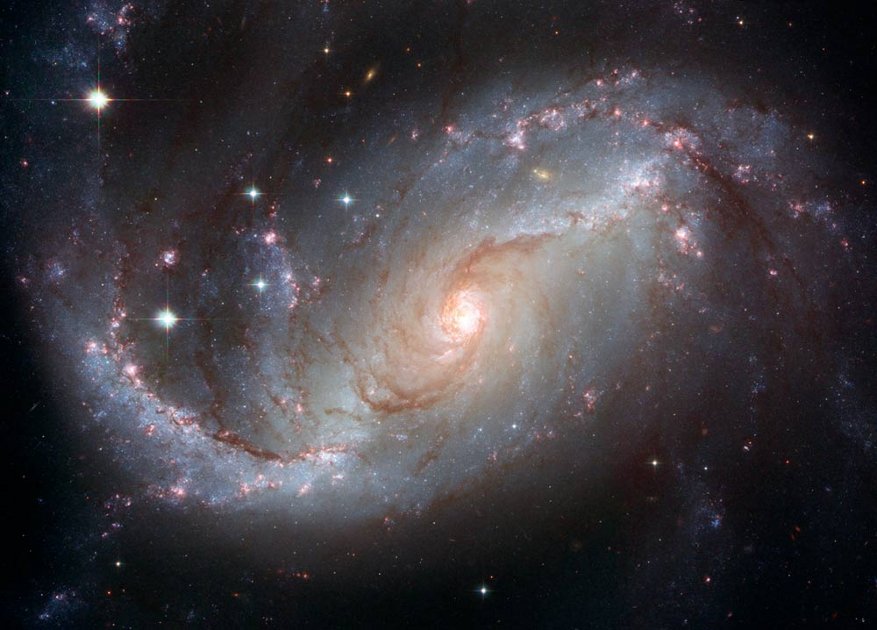
Past Research
My past research focused on simulating the effects of slit misalignment, in a long-slit spectrograph, when looking at galaxy rotation curves. In the linked images will lead to some simulation results for each galaxy. The simulations were built from data taken with a multi-fiber Integral Field Unit, spectrograph (IFU). Each fiber of the IFU takes an individual spectrum of a given position in a galaxy. From these data, many different properties of a galaxy can be inferred.
For each galaxy, the relative positions of each IFU fiber will be visible, along with the fibers considered for each long-slit simulation.
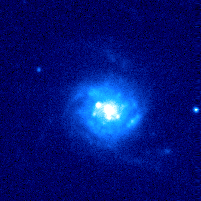
The Galaxy Sample
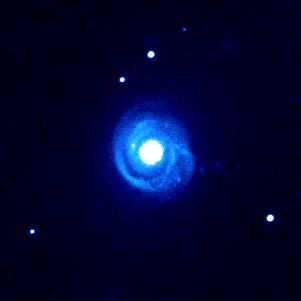
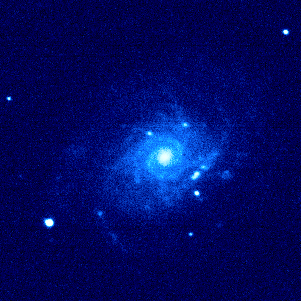
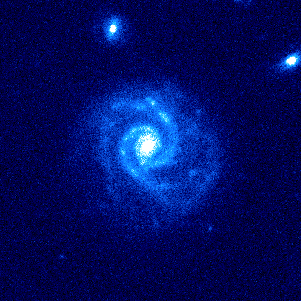 PGC 23333
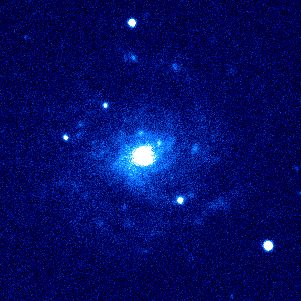
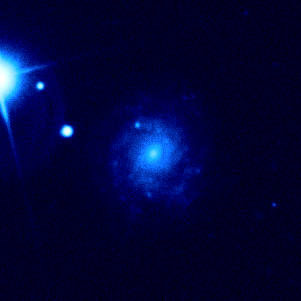 PGC 24788
PGC 26140
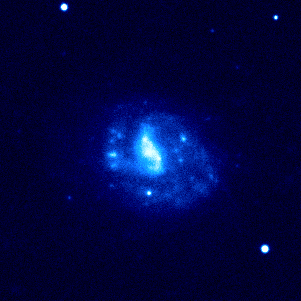
 PGC 26517
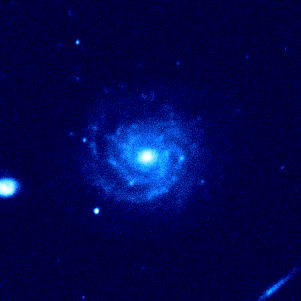
 PGC 27792
PGC 31159
 PGC 38268
 PGC 70962
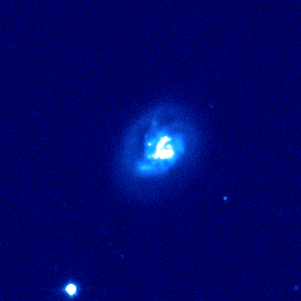
All images are from SDSS, green filter. Each was cropped in IRAF, converted to .png in DS9 and edited in GIMP.