A galaxy spectrum is composed of light emitted from the galaxy, which is separated out according to wavelength. The spectrum typically has a smooth underlying level of continuum, at all wavelengths, broken up by a few fairly narrow emission or absorption features occurring at key wavelengths.
These features are generated when electrons within atoms of hydrogen, oxygen, and other elements which make up a galaxy emit or absorb radiation. By studying these features, we can learn much about the chemical composition of galaxies. Because these features are generated by specific transitions within the atoms, they occur at specific wavelengths in the galaxy spectrum. Astronomers quickly learn to recognize patterns in spectral features, and with a little practice you will be able to do the same.
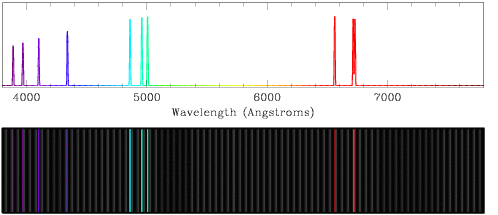
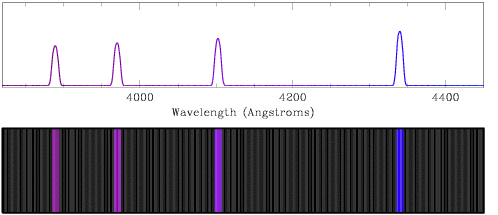
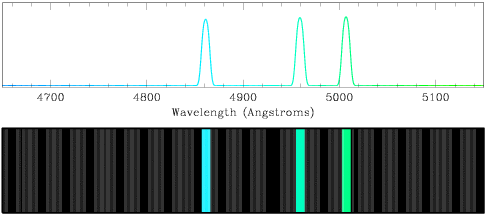
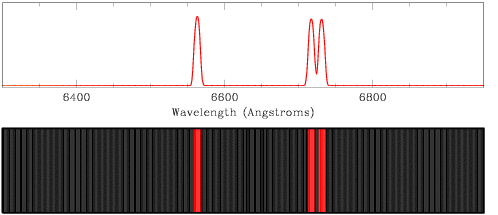
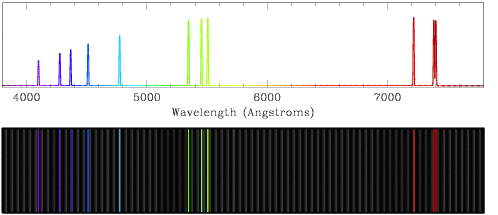
In the optical spectrum shown below, we see the typical features of a spiral galaxy like our own Milky Way. From the shortest to the longest wavelengths, key violet, blue, and red features indicate the presence of hydrogen (run your cursor over the diagram slowly, to identify the peaks at 3890, 4102, 4102, 4340, 4861, and 6563 Angstroms). The H-alpha emission line at 6563 Angstroms is one of the strongest features in galaxy spectra, and accounts for the deep red colours observed in many Hubble Space Telescope images of hydrogen in other galaxies. Less prevalent, but equally important, the neighboring green peaks at 4959 and 5007 Angstroms point to the presence of oxygen and indicate that new stars are forming in the galaxy, while the close doublet of red lines at 6717 and 6731 Angstroms is created by sulphur.
You may find yourself looking a subsection of an optical spectrum rather than the complete optical window. Because the relative spacing of the lines is constant, you can identify the region by looking for sets of lines which lie closely together. Without looking at the wavelengths marked on the x-axes of the three following figures, you should be able to match each one to a different portion of the total optical spectrum shown above. Examine the colours and the pattern of the lines in each one.
Which elements create these emission lines features?
Would you expect to find red in a Hubble Space Telescope colour image of a galaxy with this spectrum?
There is one more important factor that we need to understand when examining optical galaxy spectra. In order to correctly identify any features, and the elements which produce them, we must take into account the effect of the velocity of the galaxy relative to our position in the Milky Way.
Just as the Doppler shift of an incoming train whistle makes the pitch sound higher (it lies at a higher frequency, or shorter wavelength), and when the train is moving away from you the pitch sounds deeper (it lies at a lower frequency, or longer wavelength), the velocity of a galaxy moving toward us or away from us will shift the frequency and wavelength of the features in its galaxy spectrum.
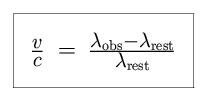
The relationship between the shift in wavelength of a given feature and the velocity of the galaxy which emits the light is well understood for nearby galaxies. The velocity v in terms of c, the speed of light, is equal to the difference between the observed wavelength of the light and its restframe wavelength, in terms of the restframe wavelength. We write these words as an equation like this:
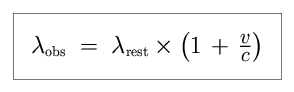
We can rewrite this equation to express the observed wavelength of the light in terms of the restframe wavelength and the velocity. This tells us that if a galaxy is moving at a positive velocity (away from us), the observed wavelength of any particular feature will be larger than its restframe wavelength. If a galaxy is moving with a velocity less than zero (toward us), the feature will have a smaller wavelength than in the restframe.
All of the spectra drawn above assume that the galaxy under observation is not moving with respect to the Milky Way. The emission features generated by the presence of hydrogen, for example, lie at the same wavelengths as features found in hydrogen gas studied in a laboratory here on Earth. Let us return to the first spectrum drawn at the top of this page (we'll redraw it right here). From now one, we will refer to a spectrum like this as a restframe spectrum, because the source of the light is at rest relative to us.
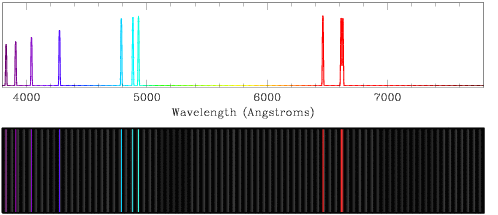
You should be able to identify the same pattern of emission lines within both spectra, with one critical difference - all of the lines in the lower spectrum appear at longer wavelengths than their restframe counterparts. We have the same set of four hydrogen features at blue wavelengths, but now all four lines lie to the right at wavelengths larger than 4000 Angstroms. We next encounter three emission lines which cluster together; rather than exhibiting light blue and green colours, they have shifted toward longer wavelengths and yellower colours. Finally, the features found in the red portion of the spectrum are at redder and redder colours. Because all of the features have shifted together to the right, in the direction of the red end of the optical spectrum, we say that this spectrum is redshifted. The faster than the galaxy is moving away from us, the larger the shift in wavelength of every feature within the spectrum.
Once you are comfortable with the concept of a redshifted spectrum, your sense of balance and fair play may lead you to ask about the existence of its doppleganger (twin), namely the blueshifted spectrum. Though most galaxies within the Universe are expanding away from us, and have redshifted spectra, we have a few neighbors which are coming closer and closer to the Milky Way and have blueshifted spectra.
Here is a sample blueshifted spectrum. You can see, for example, how the three features near to 5000 Angstroms now lie well below this limit, and have turned from green to blue. The bluest features in our spectrum are now in danger of falling off of the left hand edge of the spectrum; if the galaxy were moving slightly faster toward us, they would have been shifted to shorter wavelength ultraviolet wavelengths, and be lost from our optical spectrum. You would be able to identify the overall shift of the spectral lines even without them, however, by keying on the three lines near to 5000 Angstroms and their characteristic relative positions.
At first it may seem incorrect that such galaxies would exist - after all, if the entire Universe is expanding outward, how could anything be getting closer to us? The solution to this puzzle becomes clear when we consider the effect of gravity. Because gravity is a strong force which attracts nearby objects together, when galaxies are quite close to each other their self-attraction can overwhelm the overall expansion of space. The nearest large galaxy to us, Andromeda, is in fact on a collision course with the Milky Way, and the two galaxies will eventually merge into one.