A review of basic absorption and emission theory can be found here, and examples of various stellar spectra can be found here.
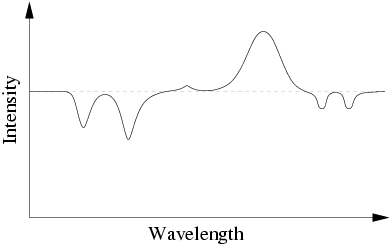
Spectra can be characterized as continuum radiation, upon which are superimposed emission and absorption lines resulting from transitions between energy levels in atoms or molecules. One observes absorption lines when atoms absorb photons at a particular frequency, typically from broad-band radiation, and emission lines when they emit photons.
|
| [NMSU, N. Vogt] |
Energy transitions triggered by electronic excitation and de-excitation of atoms and molecules are observed primarily at optical and UV wavelengths. Transitions induced by vibrations of atoms an be observed at infrared and submillimeter wavelengths and those resulting from the rotation of molecules can be observed at radio wavelengths.
The detailed shape of a line profile is determined by the abundance of the element or compound producing the line, as well as the pressure and temperature of the environment. The absorption depth is defined as
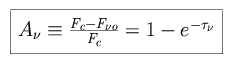 |
where Fc is the flux density of the continuum background and
F o is the flux density
at the center of the absorption line. For unresolved lines, one can measure
the equivalent width, EW as follows.
o is the flux density
at the center of the absorption line. For unresolved lines, one can measure
the equivalent width, EW as follows.
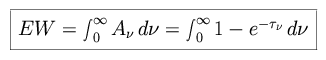 |
The equivalent width is equal to the area between the line and the
continuum. For an absorption line, the equivalent width is equal to the width
of a pure black line (Fo
= 0), with the same total flux as that absorbed by the line. The absorption
depth, A, of the line is
determined by the optical depth  , where o is the optical depth at the
center of the line and
, where o is the optical depth at the
center of the line and  is the line shape.
 |
 is the extinction coefficient at
the frequency , and o is the extinction coefficient at
the line center.
is the extinction coefficient at
the frequency , and o is the extinction coefficient at
the line center.
If the thermal structure of the medium is known, spectral line profiles can be used to derive the integrated density of the absorbing material. If the line is not resolved but the line shape is known, measurements of the equivalent width can be used. For an optically thin line, the equivalent width can be expressed as follows.
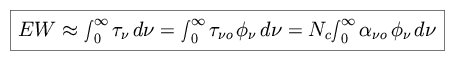 |
where
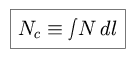 |
is the column density of the absorbing material. The equivalent width increases linearly with Nc as long as the material is optically thin. As the optical depth increases, the line profile becomes saturated and the equivalent width cannot continue to increase linearly with the column density. A plot of the equivalent width as a function of column density is called a curve of growth, and can be used to determine the abundance of an element from its observed line width. Note that for some line profiles there may be a regime in which the curve of growth is essentially flat, where the equivalent width is nearly independent of column density.