What is the difference between the average and the median value of a sample?
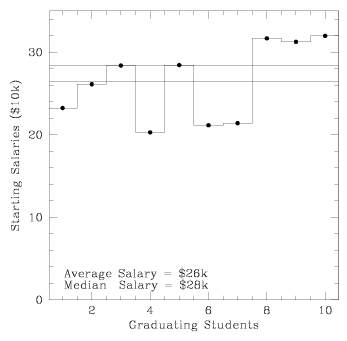
Let us say that ten people in this class so enjoy astronomy that they decide to go to graduate school and get a MS or a PhD in the field. A few years later, they graduate and take starting positions teaching and doing research at universities. The plot below shows the distribution of their first-year salaries, which range from $20k to 32$k. Because the distribution is pretty uniform, both the average and the median values are ~ $27k.
|
| [NMSU, N. Vogt] |
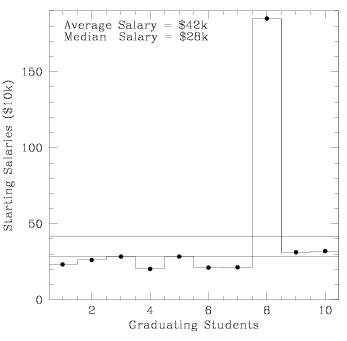
But wait! Let us say that one of the students decides to leave the field of astronomy. She takes a lucrative job offer to become a professional drummer with C. J. Chenier, and starts raking in $185k per year. The median salary value is still $28k, but suddenly the average value has risen to $42k. But can any of the other astronomers expect to make more money because of this? Can any of them expect to make anything near to the average salary? In this case, the median salary value is more informative than the average salary value.
 |
| [NMSU, N. Vogt] |