Radioactive elements can be used to date rocks, but only if the radioactive element and its decay product remain trapped in the same rock. Thus, radioactive dating gives us the solidification age, or the age when the rock first formed into a solid structure. We have conducted radioactive dating on samples from the following bodies. Remember, we need an actual piece of rock to sample, and the number of objects in the solar system we have sampled is small.
We can simulate radioactive decay by flipping a coin. For each period of time equal to a half-life, a coin flip determines whether a given atom decays (circle turns blue), or stays in the unstable state (circle stays yellow). In the diagram below, we have measured the state of 64 atoms, over ten half-lives. Each successive row shows the number of atoms which have decayed in blue, and those which remain in the unstable state in yellow. In a real sample, of course, we would have better statistics because we would have a much larger number of atoms to measure. After ten half-lives, all of our 64 atoms have decayed from the unstable state into a stable state.
 |
| [NMSU, N. Vogt] |
For the case of 238U decaying into 206Pb, how much time it would it take to track a sample through 7 half-lives? When we study meteorites, we cannot trace each successive step. Instead, we measure the ratio of 238U to 206Pb and decide how many half-lives have passed since the rock solidified. If the ratio is high, the rock is young. If the ratio is low, the rock has had time for the radioactive elements to decay, and it is old.
For the case of 14C to 12C, how much time it would it take to track a sample through 7 half-lives? Carbon dating is often used on organic, biological samples, to determine the era in which they lived.
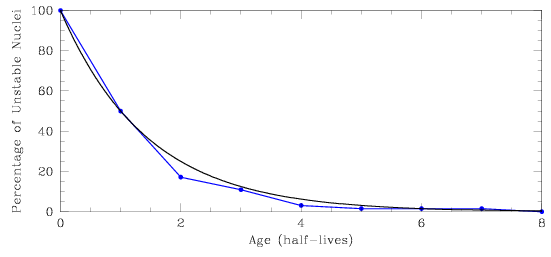
The plot below shows the percentage of unstable nuclei remaining in a radioactive sample after up to eight half-lives have passed. We see that for each time interval of one half-life, 50% of the unstable nuclei which remain will decay. The blue curve shows the relationship found for our sample of 64 atoms, while the black curve is derived from a much larger sample (and therefore has a smoother shape). If you wanted to get an accurate measurement of the age of a particular sample, what would be the best time (the best part of the curve) to make the measurement – after one half-life, or after seven half-lives?
 |
| [NMSU, N. Vogt] |