Create a plot by choosing from the plotting options in the pull-down menu
above, filling in labels in the text boxes, and placing the numbers to be
plotted in the large box shown below. For a histogram, enter a single number
per line in the large box. For a y-versus-x plot, enter both an x and then a
y value on each line, and for a y-versus-x plot with associated errors, enter
an x and a y value and then an associated error on each line, separated by
white space (blanks). A sample of each type of input file is shown below.
Plotting Options:
If you want to start out by plotting some sample data, select from one of the
three Sample plotting options in the pull-down menu above, fill in a
title and x and y axis labels in the text boxes, and you will be able to
recreate any of the three sample plots shown at the bottom of this page.
You might occasionally want to invert an axis to run from large values to
small rather than from small to large, if you plot the brightness of an object
in units of magnitudes. (Recall that the magnitude scale is defined so that
objects with larger magnitudes are actually fainter than those with smaller
magnitudes.) Most of the time, however, you should not need to invert either
axis.
If you are plotting the relationship between x and and y, you will usually
want to add a linear fit (showing the best-fit line which attempts to pass as
closely as possible to all of the points). You may, however, elect to hide
this line.
You can require that this best-fit line passes through the origin.
Double-check that you have selected the type of plot that you wish to create
from the pull-down menu above (histogram, y-versus-x plot, or y-versus-x plot
with errors), and then hit the "Create Plot" button below.
Numbers to plot:
Be careful when creating an input file. Do not leave blank lines, or add
extra entries to the lines that contain the numbers to be plotted.
Here are sample plot input files which will produce various forms of plots.
Be sure to enter the suggested titles and labels into the boxes above.
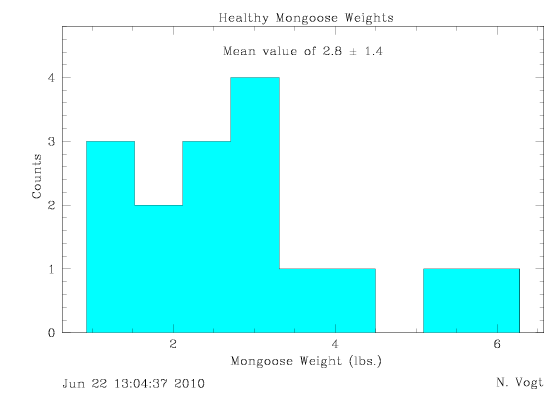
Histogram of mongoose weights, with weights listed one per line.
Title:
Healthy Mongoose Weights
X-Axis Label:
Mongoose Weight (lbs.)
Y-Axis Label:
Counts
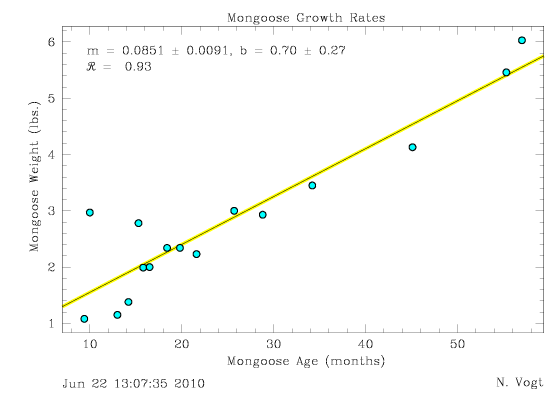
Plot of mongoose weight versus age with a linear fit to the data, with ages
(x-axis) and weights (y-axis) listed in pairs on each line.
Title:
Mongoose Growth Rates
X-Axis Label:
Mongoose Age (months)
Y-Axis Label:
Mongoose Weight (lbs.)
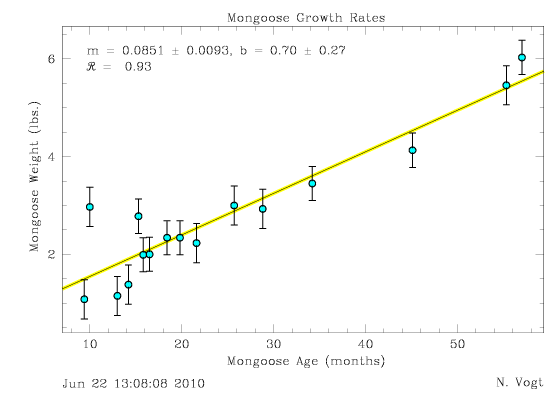
Plot of mongoose weight versus age with a weighted linear fit to the data,
with ages (x-axis), weights (y-axis), and errors in weight measurements listed
in sets of three on each line.