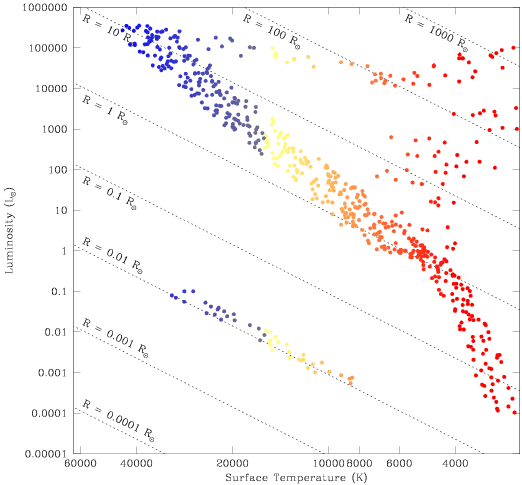
We can learn a great deal about the properties of white dwarfs by examining their position on the Hertzsprung-Russell diagram. Where can we find them there?
Place the cursor on a region where white dwarf stars lie on the figure above, and click with your mouse. A separate browser window will appear with information about stars found in that region. You should be able to estimate their luminosity, temperature, and radius by eye. If you know the value of two of these three quantities exactly, you can calculate a specific value for the third as well.

You can read off the temperature of a star by tracing a line down from the cursor to the x-axis. (The x-axis is the line drawn on the bottom of the figure, running from a hot 60,000K on the left to a cool 4,000K on the right.) Find the point along this line which falls below the cursor: this will tell you the approximate temperature of the stars found in the region that you have selected.
Next, you can read off the luminosity (or brightness) of the star by tracing a line over to the left from the cursor to the y-axis. (The y-axis is the line drawn on the left hand side of the figure, running from a faint 0.00001 L_sun, one hundred thousand times fainter than the Sun, on the bottom to a bright 1,000,000 L_sun, one million times brighter than the Sun, on the top.) Find the point along this line which falls to the left the cursor: this will tell you the approximate luminosity of the stars found in the region that you have selected.
Finally, you can read off the radius (or size) of the star. There are eight diagonal lines running across the image, labeled R = 0.0001 R_sun (bottom left corner) to R = 1,000 R_sun (upper right corner). Find the line which is nearest to the cursor: this will tell you the approximate size of the stars found in the region that you have selected.
Place your cursor within the region in the lower left corner, where white dwarfs are found, and read the values of L, T, and R for yourself from the diagram. Then calculate specific values for the luminosity, temperature, and size of these star, by assuming values for two of the three quantities.