There are two types of waves that we will study, waves propagating over a distance, and waves propagating through time. An ocean wave is a fine example of both types of waves.
A Wave Traveling Through Space
Consider first a wave which propagates over a distance. If you stand on a
pier above the ocean and watch the waves roll into the shore, you can observe
that at any instant the water forms a wavelike shape, with a steady
progression of peaks and dips as you move from the shore outward toward the
sea.
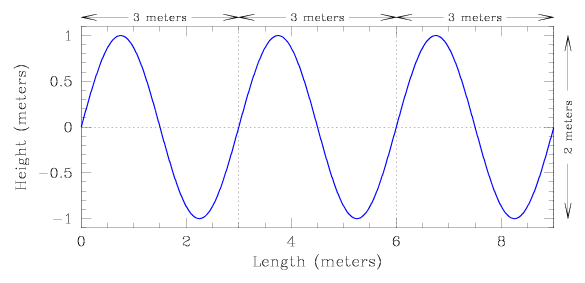
In the example shown below, the water would be at its lowest height (the
nadir) 2.25 meters, 5.25 meters, and 8.25 meters from shore, and would be at
its highest (the peak) 0.75 meters, 3.75 meters, and 6.75 meters from shore.
For a wave traveling through space, we examine how it rises and falls over a distance, at a particular instant in time. We can characterize the behavior of the wave as follows.
A Wave Traveling Through Time
Consider second a wave which propagates through time. If you stand on a pier
next to a particular fencepost and watch the waves roll into the shore, you
can observe how the water that passes your fencepost forms a wavelike shape,
with a steady progression of peaks and dips passing toward the shore.
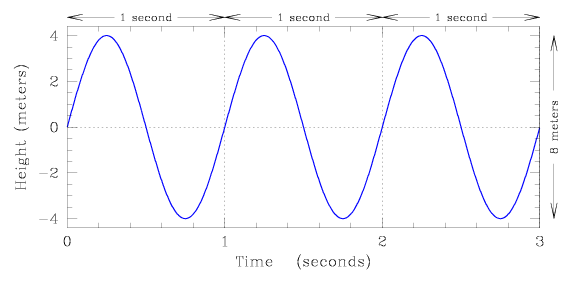
In the example shown below, the water would be at its lowest height (the
nadir) after 0.75 seconds, 1.75 seconds, and 2.75 seconds, and would be at its
highest (the peak) after 0.25 seconds, 1.25 seconds, and 2.25 seconds.
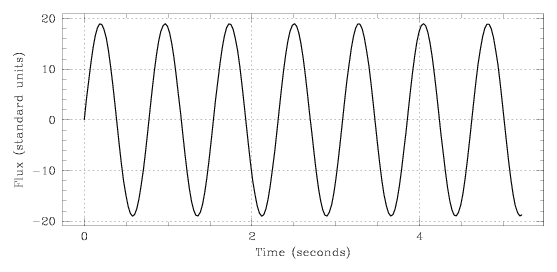
For a wave traveling through time, we examine how it rises and falls over time, at a particular position in space. We can characterize the behavior of the wave as follows.
Visual Light Waves
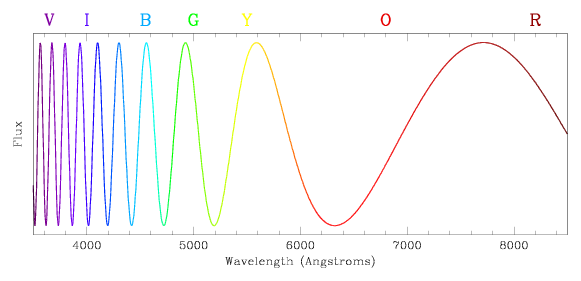
For a wave of light with a wavelength between 3800 and 7400 Angstroms, we can
connect the wavelength to a color as perceived by our eyes. The shortest,
bluest wavelength light that we can see lies at about 3800 Angstroms (one
Angstrom is one hundred millionth of a centimeter), and the reddest light we
can perceive has wavelengths of roughly 7400 Angstroms. The next figure shows
how the wavelength correlates with the color of the light.
We like to use blue and red as the end points of this plot, and so we say that green light is redder than blue light (which just means that green light has a longer wavelength than blue light), yellow light is redder than green light, and red light is reddest light of all. Similarly, red light is the least blue, orange light is bluer than red light, yellow light is bluer than orange light, green light is bluer than yellow light, and blue and violet light are the bluest of all the colors that we can see.
Measuring with Accuracy
It is important to make measurements as carefully as possible, when reading
from a figure. Here are a couple of tricks to help you to do this as easily
as possible.
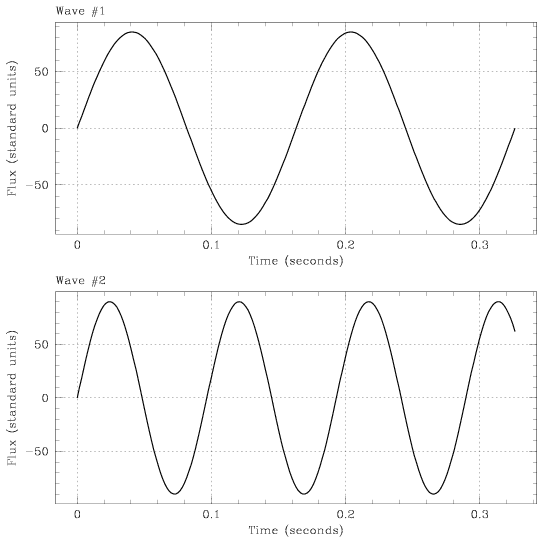
If we attempt to measure the crossing point after a single period, we get a value of P = 0.70 ± 0.05 seconds. Our value has fairly large error bars, ranging from 0.65 to 0.75 seconds. But what if we instead measure the crossing point after six periods have passed? We now get a value of 6 × P = 4.6 ± 0.05 seconds. To determine the length of one period from this measurement, we divide by a factor of six and get P = 0.77 ± 0.008 seconds. The error has dropped by a factor of six!
This may seem a difficult choice if you attempt to make an absolute measurement of the amplitude of each wave. But we don't need to measure the exact height of each wave – we just need to know which one goes higher than the other.
Take a close look at the tick marks along the y-axis. Both plots have the 50 mark identified with a 50, and then have four small tick marks above indicating the positions of 60, 70, 80, and 90 standard units. On the top plot, there is very little extra space above the 90 tick mark. On the bottom plot, however, there is a lot of space above the 90 tick mark (the bottom plot goes almost all the way to 100 standard units). This tells us that Wave #2 must have a slightly higher amplitude than Wave #1, because it forced the y-axis to extend to a slightly larger value.