Math Fun: Graphing
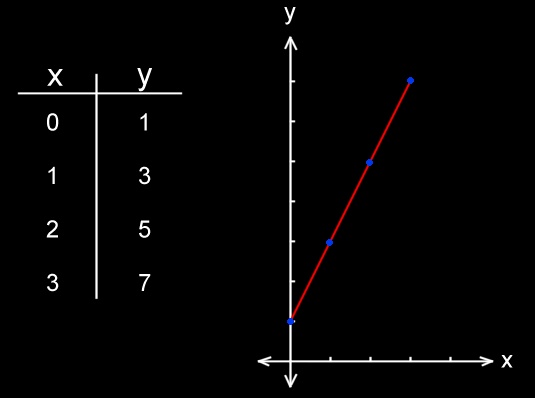
Now we take our list of values, plot the points on the graph, and draw a line through it:
In y = mx + b, the "m" is the slope of the line: how quickly does it rise (or fall) as we move along the x-axis.
The "b" is the y-intercept of the line: the place where it crosses the y-axis.