 |
| [CSIRO Australia, 2004] |
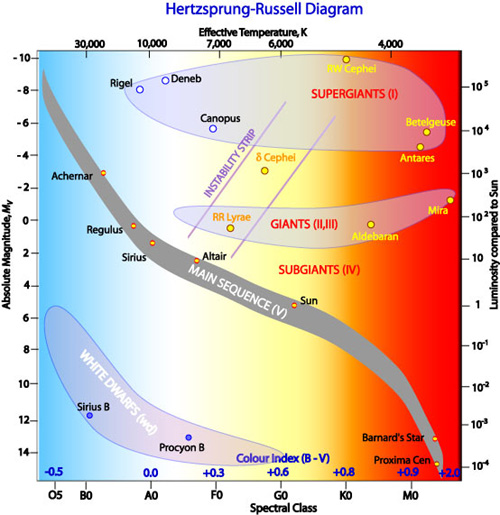
Here is another representation of the Hertzsprung-Russell Diagram, showing the relation between stellar surface temperature, or stellar class, (x-axis) and luminosity (y-axis) for nearby stars. We are now going to explore the way that a star changes its position on the H-R diagram, over the course of its lifetime. We can divide the stars on the H-R diagram into four groups:
|
| [CSIRO Australia, 2004] |
The lifetime of a star (how long it stays burning hydrogen on the Main Sequence) depends almost exclusively on its mass. The more massive a star is, the shorter time it will exist. Even though it has more hydrogen to burn than a lower mass star, because it is more massive and therefore has more pressure in its core, it will burn through its fuel at a much faster rate. As a star nears its end, it begins to burn fuel faster and faster. Because of this, the increased internal pressure pushes the outer atmosphere of the star outwards. This causes giants and supergiants to have very large sizes. They began their lives as normal stars on the Main Sequence, and then as they ran out of fuel they shifted upwards on the H-R diagram (to larger sizes, and slightly lower temperatures).
How big can stars get? This is a hard question to answer, because the largest, hottest stars are also the most rare. Here is the current record holder, observed with the Hubble Space Telescope in 1999. The young star cluster NGC 3603, located 20,000 light-years across the Milky Way away from us, contains a star called A1. It is 114 times more massive than the Sun, so large that it would encompass the Earth if it replaced the Sun. Burning through its nuclear fuel at a dramatic rate, this star is destined to a short life and an abrupt end.
Is there an upper limit on stellar mass, or should we expect to keep discovering more and more massive objects? Gas can only collapse to form a star if the force of gravity, exerted on all of the particles by each other, is stronger than the local pressure which resists collapse. As stellar mass approaches 150 times that of the Sun this radiation pressure becomes stronger than the gravitational force, and conditions will not allow a stable star to form. Star A1 is thus probably one of the most massive stars we humans will ever find!
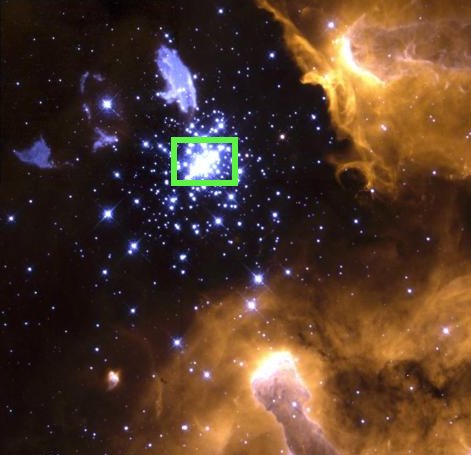 |
| Galactic nebula NGC 3603, with region containing massive stars outlined in green. [NASA/HST, Brandner, Grebel, Chu] |
There are two more forms of stellar remnants which are not shown on the H-R diagram: