Hertzsprung-Russell Diagrams for Stellar Clusters

In a stellar cluster (a densely packed group of hundreds of stars), the stars are all born at roughly the same time, with similar chemical compositions; they differ only in mass. By examining how many short-lived high-mass and intermediate-mass stars are still present in a cluster, we can estimate its age. 
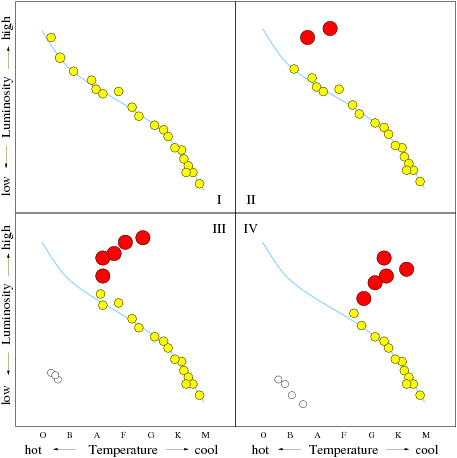
In the figure below, four stages of cluster evolution are shown. Note when both giant stars and white dwarfs start to appear.

Four-part figure on stellar evolution, showing four Hertzsprung-Russell Diagrams. All four panels show Temperature and Stellar Type on the x-axis, running from hot to cool and spanning types O, B, A, F, G, K, and M, and show Luminosity on the y-axis, running from low to high. The Main Sequence is shown as a curved blue line on all four panels, extending from the hot, high luminosity upper-left corner to the cool, low luminosity lower-right corner. In panel I yellow points extend along the entire Main Sequence, more plentiful on the low luminosity end. In panel II the highest luminosity stars at the top of the Main Sequence have evolved off, turning into giant stars. In panel III the high luminosity stars from the top third of the Main Sequence have evolved off, shifting up and to the right on the diagram and turning into giant stars. A few white dwarfs have also appeared in the hot, low luminosity corner. In panel IV more than half of the Main Sequence is empty, and the turn-off point where (the giants turn off of the Main Sequence and shift upwards and to the right) is at an even lower luminosity, and the number of white dwarfs has also increased.
[NMSU, N. Vogt]

I: A young cluster, with plenty of hot, blue, high-mass stars
II: A fairly young cluster, missing only the highest of high-mass stars
III: A moderate-age cluster, lacking O and B stars
IV: An older cluster (6 billion years old), with many intermediate-mass
 stars evolving off the Main Sequence and turning into giant stars