If you plot the brightness versus color, or spectral type, of stars you
get a scatter plot – these quantities are not correlated, and
they do not form a pattern together. If you look at this diagram, you will
see points scattered all over the place.
[NMSU, N. Vogt]
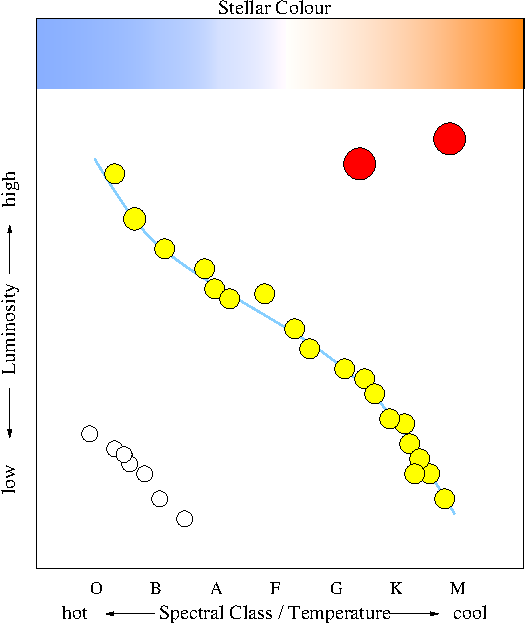
But, if we use a sample of stars for which we have known
distances, we can calculate their intrinsic luminosities. A plot
of luminosity vs spectral type (or color or temperature) is
called a Hertzsprung-Russell (H-R) Diagram, and there are some definite
patterns within it.
What patterns do you see when you look at the H-R diagram below?
Do you find stars everywhere in the diagram, or are there regions which
are sparsely populated and regions which are heavily populated?
Is there a characteristic pattern which most of the stars follow?
Do you see a trend between spectral type and luminosity?
[NMSU, N. Vogt]
The H-R diagram has played a crucial role in developing our
understanding of stellar structure and evolution. A major focus of astronomy
during the 1940's and 1950's was constructing stellar models that would
accurately predict the luminosity - temperature relation seen in the H-R
diagram.
For now, we will note some interesting things about the differences
between the nearby stars and the brightest stars and use the H-R diagram to
demonstrate one more property of stars.
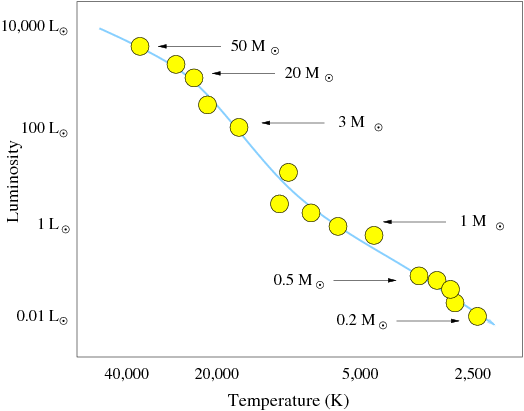
Most stars fall along a sequence that is called the Main
Sequence. For this sequence, there is a strong correlation, in the sense
that hotter stars are also more luminous.
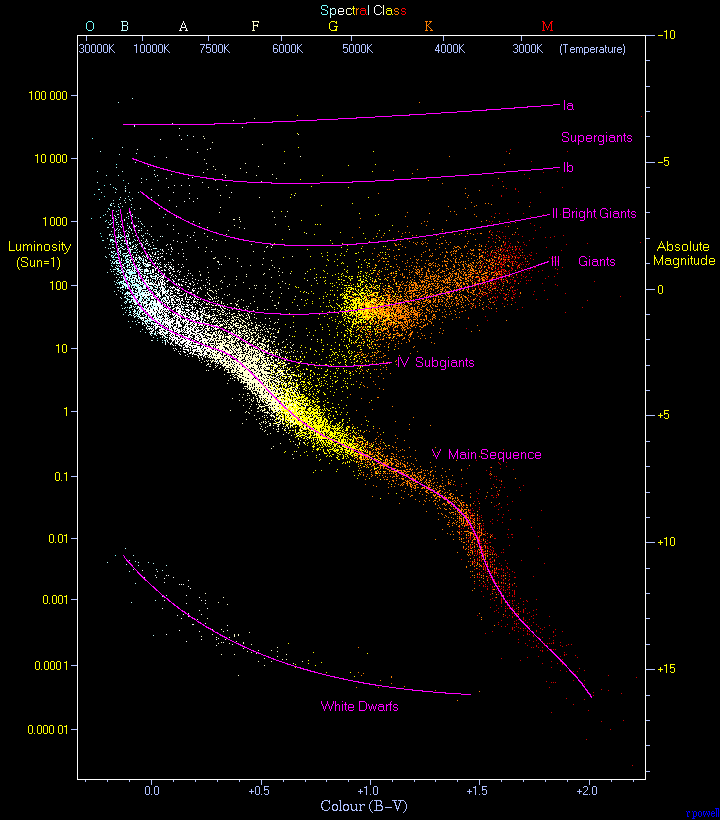
Here is another version of the H-R diagram, showing the distribution of
many nearby stars. A dot is placed on the diagram for each observed star, and
the color of the dot corresponds to the stellar temperature. Note how the
bulk of the stars lie along the Main Sequence, while the giant and dwarf
populations are sparser (more rare). Where does the Sun lie on the H-R diagram?
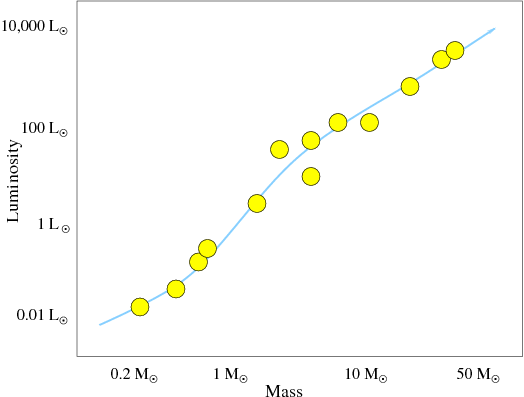
Measure the masses for as many stars as we can find (using the
techniques we discussed for binary
systems) and we will discover the mass-luminosity relation for
Main Sequence stars.
[NMSU, N. Vogt]
L
=
M3.5
Mass and luminosity are proportional to either – intrinsically
bright stars are also very massive, and intrinsically faint stars tend to be
rather low mass. This tells us that the Main Sequence in the H-R
Diagram is not only a luminosity sequence, but also a mass
sequence!
[NMSU, N. Vogt]
A more massive star generates a stronger gravitational field than a less
massive one. This creates higher pressures in the stellar core, which means
that the star converts its fuel into energy faster and more efficiently.
Though high mass stars have larger fuel supplies than low mass stars, they
burn through it more quickly (hence they are much brighter), so their Main
Sequence lifetimes are far shorter.
Thanks to Mike Bolte (UC Santa Cruz) for the base contents of this slide.