What kind of stars are found here?
A star in this region of the Hertzsprung-Russell diagram has a temperature of
roughly 9,000 kelvin (9,000 K), a luminosity 1400 times less than that of the
Sun (0.0007 × L ), and a radius one hundred times smaller than the Sun
(R = 0.01 × R).
This star lies along the narrow band in size, where white dwarf stars are
found. The low temperature indicates that this star is the end-product of a
nova of a low-mass star that took place quite some time in the past (a younger
star would not have had time to cool, and to move down the white dwarf
sequence to such extremely low luminosities and cool temperatures).
), and a radius one hundred times smaller than the Sun
(R = 0.01 × R).
This star lies along the narrow band in size, where white dwarf stars are
found. The low temperature indicates that this star is the end-product of a
nova of a low-mass star that took place quite some time in the past (a younger
star would not have had time to cool, and to move down the white dwarf
sequence to such extremely low luminosities and cool temperatures).
Try to read the values of L, T, and R for yourself from the diagram. Do
you estimate values for the luminosity, temperature, and size of the star
similar to those listed above?
How much fainter has this white dwarf become since its formation?
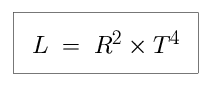
We can use the Stefan-Boltzmann Law to relate the temperature (T), size (R),
and luminosity (L) of a star to each other, and so determine how much this
white has faded over time. Measuring L, R, and T in solar units, we say that:
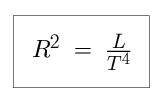
 Solving for R squared, we see that
 Examining the distribution of white dwarfs in the diagram, we observe that
there is very little scatter in their sizes – they are uniformly
one-hundredth the size of the Sun, no matter how hot or cold they are, no
matter how bright or faint they are. We can use this fact to relate the
luminosity and temperature of white dwarfs at each end of the temperature
sequence.
Examining the distribution of white dwarfs in the diagram, we observe that
there is very little scatter in their sizes – they are uniformly
one-hundredth the size of the Sun, no matter how hot or cold they are, no
matter how bright or faint they are. We can use this fact to relate the
luminosity and temperature of white dwarfs at each end of the temperature
sequence.
Imagine one white dwarf, called A, has just entered the white dwarf phase,
while another, B, has been cooling and fading for billions of years.
As all white dwarfs share the same radius,

We want to find out how much fainter the cooled white dwarf is, so we solve
for the ratio of the luminosities. By examining the white dwarf sequence on the
Hertzsprung-Russell diagram, we can estimate the hottest and coolest
temperatures as 29,000 K and 9,000 K.
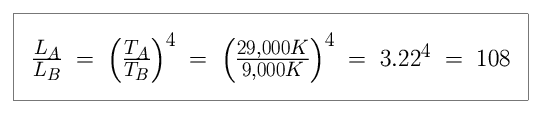 The white dwarf has become one hundred times fainter as it cooled, ending up
one-thousandth as bright as the Sun. Imagine how difficult it would be to
find it in a telescope image!
The white dwarf has become one hundred times fainter as it cooled, ending up
one-thousandth as bright as the Sun. Imagine how difficult it would be to
find it in a telescope image!