What kind of stars are found here?
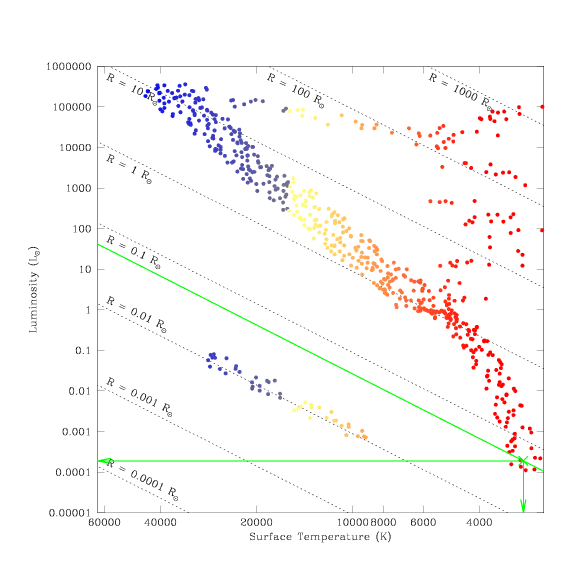
A star in this region of the Hertzsprung-Russell diagram has a temperature of
roughly 3,000 kelvin (3,000 K), a luminosity five thousand times fainter than
that of the Sun (0.0002 × L ), and a radius one-twentieth that of the
Sun (R = 0.05 × R
 ).
This star lies along the Main Sequence, where most stars (including the Sun)
are found. The low temperature indicates extremely red colours; these stars
would be easiest to detect using an infrared camera.
Try to read the values of L, T, and R for yourself from the diagram. Do
you estimate values for the luminosity, temperature, and size of the star
similar to those listed above?

How much fainter is the faintest star in this region than the
brightest star on the Hertzsprung-Russell diagram with the same temperature?
We can trace the green horizontal line over to the y-axis, and determine that
the faintest stars in this region (just below the green cross) have a
luminosity of 0.0001 (one-ten-thousandth as bright as the Sun).
Now shift your eyes vertically, up to the top of the diagram. Identify the
brightest stars (those nearest to the top) with the same temperature as our
faint star (they will lie directly above our star). How bright are these
giant stars? If you again trace your way over to the y-axis, you will find
that they are 100,000 times brighter than the Sun.
The different between these stars is 100,000 ÷ 0.0001, or a factor of a
billion! Clearly giant stars and faint dwarfs must be rather different from
each other!
 ), and a radius one-twentieth that of the
Sun (R = 0.05 × R
 ).
This star lies along the Main Sequence, where most stars (including the Sun)
are found. The low temperature indicates extremely red colours; these stars
would be easiest to detect using an infrared camera.
