There are two basic ways to observe a galaxy with an optical telescope: by
taking an image, or by taking a spectrum.
A telescope takes an image of a galaxy in the same fashion that you might use
a camera and black and white film to take a picture of a yourself.
[NMSU, N. Vogt]
In each case, all of the light from the object is collected; areas which emit
the most light (or, in the case of clouds and snow, reflect the most sunlight)
appear as bright regions on the pictures, while fainter areas are reproduced
in dimmer shades. Such an image conveys the overall brightness of the galaxy,
but it cannot show us the colors of the stars which make up various parts of
the galaxy, nor how these colors vary with location within the galaxy.
In order to produce a color image, we need to take multiple exposures at
different wavelengths along the optical portion of the electromagnetic
spectrum. A different filter is placed before the camera for each exposure,
one which transmits light within only a narrow range of wavelengths.
This filter lets only yellow light pass through. [NASA/HST]
By combining the exposures, we can determine which parts of the object are
brightest at short wavelengths (ultraviolet light, and blue colors), at
intermediate wavelengths (yellow colors), or at long wavelengths (red
colors, and infrared light).
For spiral galaxies like our own Milky Way, for example, we find that the
outer regions of the galaxy disk tends to have blue colors (showing the
presence of bright, young stars), while the central bulge is populated by
redder, longer-lived stars.
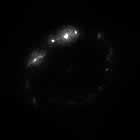
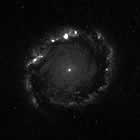
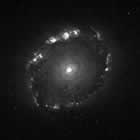
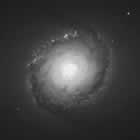
The figure below shows seven images of the galaxy NGC 1512, which was observed with the Hubble Space
Telescope. Each image was taken through a different filter, and so sampled a
different portion of the optical spectrum, and contains light of different
colors. Observe how different parts of the galaxy light up and assume
prominence at different wavelengths. If you were describing the morphology
(appearance) of this galaxy, how might your description change if you looked
at only at a short, or long, wavelength image?
[NMSU, N. Vogt]
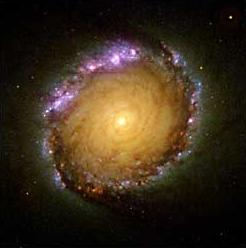
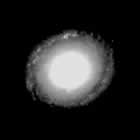
By combining the images, we can create a single color image of the galaxy.
Could you predict from the initial black and white images which components of
the galaxy would be brightest in various colors?
A multiwavelength image of NGC 1512. [NASA/HST]
A spectrum takes the idea of breaking down the light according to
colour, or wavelength, one step further than a series of images. Just as
droplets of water in the atmosphere can separate out the colours of the
sunlight into a rainbow, or a prism can split up white light into a range of
colours, a spectrograph can disperse the light emitted from an object
according to wavelength.
The figures below show spectra of optical light. The x-axis
runs from short, blue wavelengths on the left to long, red wavelengths on the
right. The y-axis indicates the amount of light emitted at each wavelength -
the higher the level of the signal, the more light is present. In each case,
the top plot is a line plot showing intensity versus wavelength, while the
lower plot represents the spectrum as it would appear at the telescope.
By breaking the light down by wavelength, we are able to search for key
features which indicate the presence of certain elements in the stars which
form the galaxy. These features may not be strong enough for the eye to find
them hidden in an image containing light from a range of wavelengths, because
they are very narrow (covering only a few wavelengths out of thousands), but
once the light is distributed by wavelength they are easy to identify.
Spectra can be divided into three broad categories.
Continuum spectra show a relatively smooth shape, with no
strong features as a function of wavelength. In the case shown below, the
peak of the curve lies just below 6000 Angstroms (like the shape of the
spectrum of light emitted from the Sun).
[NMSU, N. Vogt]
Absorption spectra are similar to continuum spectra, but light is
missing at certain wavelengths (in this case, indicating that hydrogen is
being absorbed). Observe how the absorption features (the low points) in the
top line plot are echoed as black bands in the lower plot.
[NMSU, N. Vogt]
Emission spectra contain a very small amount of continuum flux (low
amounts of light distributed evenly at all wavelengths), with extra peaks of
light at certain wavelengths (in this case, indicating that hydrogen is being
emitted). In general, the emission features in an emission spectrum are
narrower than those in an absorption spectrum. Observe how the emission peaks
in the top line plot are echoed as bright lines in the lower plot.