Florence Nightingale (1820 – 1910)
``The most important practical lesson that can be given to nurses is to teach them what to observe – how to observe – what symptoms indicate improvement – what the reverse – which are of importance – which are of none – which are the evidence of neglect – and of what kind of neglect.... But if you can not get the habit of observation one way or other, you had better give up being a nurse, for it is not your calling, however kind and anxious you may be.''
``To understand God's thoughts, we must study statistics, for these are the measure of His purpose.''
Florence Nightingale is well known, and revered, for her work in the field of nursing. She revolutionized the practice of English medicine by arguing the case for germ theory and setting standards for cleanliness and hygiene in hospitals, by defining specific requirements and abilities for nurses, and by legitimizing nursing as a reputable profession for women.
She is also acknowledged for her insightful scientific prowess, particularly formidable in an era in which women were forbidden to study at university, and banned from many fields of scientific inquiry (e.g. mathematics). She pioneered the use of statistics to identify the significant causes of death in patients, and developed new forms of analysis which illuminated them in a striking fashion that could be understood by non-mathematicians.
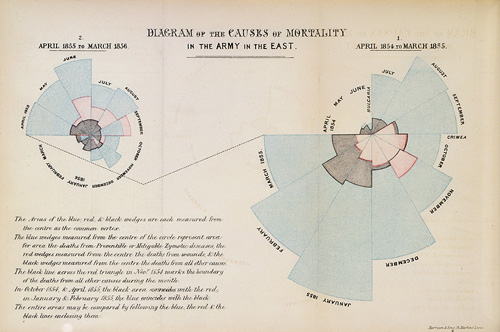
The diagram below is Florence Nightingale's inventive polar-area diagram showing the mortality rates in the British Army Hospital during the year of 1855 of the Crimean war. The central orange wedges show the proportion of deaths from wounds. The outer blue wedges represent the proportion of deaths from preventable contagious diseases. The black wedges in the middle show deaths from all other causes. What do you think was the ratio between deaths due to wounds and deaths due to preventable contagious diseases? Where do you think the British Army should have directed their efforts to best decrease mortality rates – on the battlefield, or to the hospital tables and basins?
|
|