An On-line Review "Paper"
Copyright 1999
by
Chris Churchill
last update 12/99
Galaxies and other "metal" enriched, gaseous structures that lie
between Earth and any extremely distant, background quasar give rise
to absorption lines in the quasar's spectrum. For a more complete
description of these "quasar absorption line systems", click
here.
Below is a Hubble Space Telescope, or HST, image (WFPC2)
centered on the quasar 3C 336 (1622+238), which has a redshift of
z=0.927. This field has been extensively studied by
Steidel
et al. (1997, ApJ, 480, 568).
A Mg II absorption-selected galaxy is one which was identified or discovered
following a priori knowledge of Mg II absorption in the
spectrum of a background quasar.
The view of the line of sight (LOS) in the redshift dimension is shown in
the lower panel. Note that the LOS does not pass through the steller component of the galaxy (shown in
green), but in front of it from this vantage point. The galaxy
is at lower redshift than the quasar
(red), and therefore lies between us and the quasar (thus the
term intervening absorber).
 |
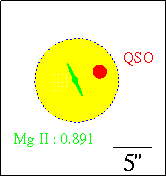
Caption: A schematic of the Mg II absorbing galaxy at z=0.891, which is just to the left of quasar in the HST image. The galaxy itelf is green and the quasar is red. The extended gaseous "halo" around the galaxy is yellow and protrudes in front of the quasar. It is the material directly between us and the quasar that gives rise to the absorption. |

|
| Caption: (upper left) A deep HST image of the 3C 336 field, centered on the quasar (labeled QSO). At redshifts smaller than that of the quasar are four galaxies (labeled in white with redshifts given), whose gasesous extent protrudes in front of the quasar, as schematically shown in the panel to the right of the image. In the quasar spectrum, these gasesous components to the galaxies give rise to Mg II and C IV absorption. (bottom) Illustration of the quasar light path to the observer (a side view). HST Image courtesy of Chuck Steidel. |
To date, the most extensive Mg II surveys have been conducted by
Lanzetta,
Turnshek, & Wolfe (1987, ApJ, 322, 793),
Sargent,
Steidel, & Boksenberg (1988, ApJ, 334, 22),
Petitjean
& Bergeron (1990, A&A, 231, 309),
Steidel
& Sargent (1992, ApJS, 80, 1),
and
Churchill
et al. (1999, ApJS, 120, 51).
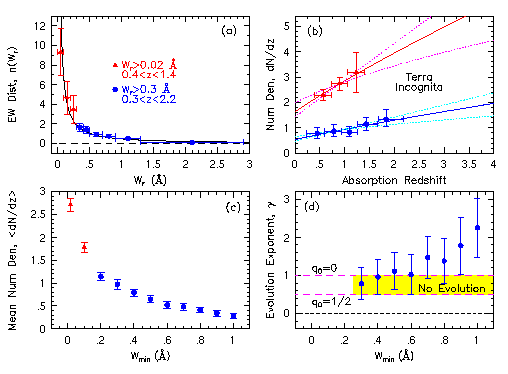
The redshift coverage and rest-frame equivalent width detection limits
(i.e. sensitivity) are summarized in the figure below.
The blue data are from the low resolution
survey by Steidel & Sargent of 103 quasars, covering the redshift
interval 0.3 to 2.2 and complete and unbaised for W_min > 0.3 Ang.
The red data are from the HIRES/Keck survey by
Churchill et al. of 26 quasars, covering the redshift interval 0.4 to
1.4 and complete to W_min > 0.02 Ang (unbiased only for systems with W
< 0.3 Ang).
Presented here are four key statistical properties: ( panel a ) The equivalent width distribution, n(W), which gives the number of systems per unit equivalent width per unit redshift; ( panel b ) The number density of absorbers with equivalent widths, W, greater than a well-defined minimum, W_min, measured over finite redshift bins; ( panel c ) The mean number density, < dN/dz > , over the total observed redshift range, for systems with W > W_min; ( panel d ) The "evolution parameter" (the slope on the log(dN/dz) vs. log(z) plane, the log-log version of panel b) for systems with W > W_min. The blue and red data points correspond to the Steidel & Sargent and the Churchill et al. surveys, as described above and shown in the top panel.
| Caption: The statistical properties of Mg II absorbers. The samples of Steidel & Sargent (1992, ApJS, 80, 1) [blue data] and Churchill et al. (1999, ApJS, 120, 51) [red data] are combined here, giving the full range of measured equivalent widths. Note, however, that the redshift coverages are not identical- if the weakest systems evolve from z=1.4 to 2.2, the results would be affected. See text for detailed descriptions of the panels. |
RESULTS (for the given redshift intervals shown and W_min):
The strong, resonant Mg II 2796,2803 doublet is easily identified
in the specta of quasars.
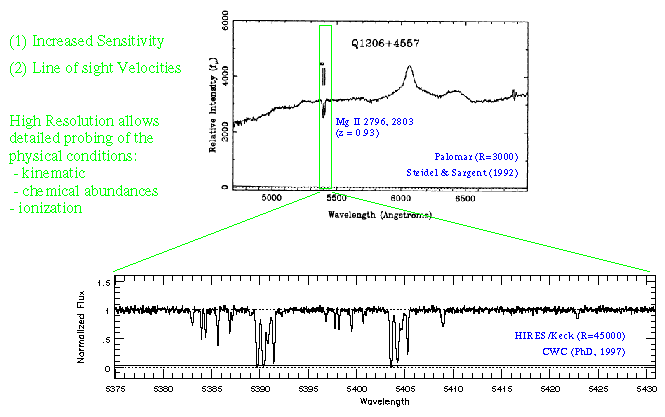
The top panel of the figure below is a R=3000 spectrum of PG 1206+459,
obtained by
Steidel
& Sargent (1992, ApJS, 80, 1)
on a 4-meter class telescope.
A Mg II doublet at redshift z=0.93 is shown, which places it at the
observed wavelength of ~5400 Angstroms.
The 1990's and 10-meter class telescopes brought high resolution into
the fold.
The lower panel shows a Keck/HIRES spectrum of the highlighted
wavelength region
(Churchill, 1997, Ph.D. Thesis).
The resolution is R = 45,000, or roughly 6 km/s in the rest frame of the
absorber.
Note that the 2796 transition (5383-5392 A) and the 2803 transition
(5396-5406 A) have been resolved into multiple components.
Also note the detection of a "weak" system at z=0.9343, about 1000
km/s to the red of the larger, complex system.
A detailed study of this "triple", or complex "double" system, has been
published by
Churchill
& Charlton (1999,
AJ, 118, 59).
|
Caption:
Illustration of the detailed revealed when high resolution spectra are
brought to bear on Mg II absorbers. (1) The detection sensitivity is
increased to very small equivalent widths (~0.02 A, rest-frame)
allowing very "weak" clouds to be observed. Note that most of the
profiles from these weak clouds remain unresolved even with
HIRES/Keck. (2) The line of sight kinematics are probed.
The HIRES spectrograph was possible because of the dedicated work of many individuals at the University of California, Santa Cruz. In particular, the PI Steven S. Vogt is due great credit for his 5+ years of effort. |
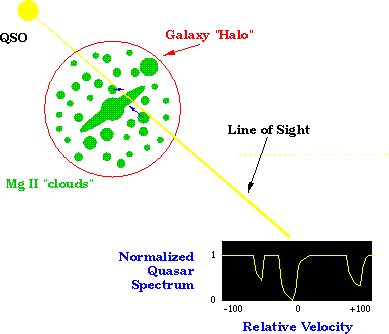
In the below schematic, a distant, "background" quasar is shown in
the upper left, its light path (labeled "Line of Sight", LOS) passing
through a galaxy disk and halo and being dispersed into a spectrum
(lower right) of the Mg II 2796 transition.
The spectrum is normalized and converted to rest-frame velocity
(in km/s) relative to an arbitrary zero point.
The green parts of the galaxy represent the
locations of low ionization gas clouds that give rise to Mg II
absorption.
In this example, the LOS passes through the galactic disk and two of
the halo clouds, whose velocities are
represented with the blue arrows.
The disk gives rise to the largest absorption, which is arbitrarily
given velocity ~0 km/s.
The larger of the two halo clouds is moving almost directly away from
the observer, infalling into the disk at ~+100 km/s.
The smaller cloud is also infalling into the disk toward the observer.
Its velocity is not directly along the LOS, resulting in a velocity of
~-50 km/s, and its absorption cross section (due either to ionization
condition or physical size, or both) is smaller, resulting in weaker
absorption.
| Caption: A cartoon illustrating the physical interpretation for the multiple component Mg II absorption profiles seen in high resolution quasar spectra. The cloud velocities are dependent upon the line of sight component of the "cloud" motions, and the absorption strengths are dependent upon the cloud absorption cross sections. |
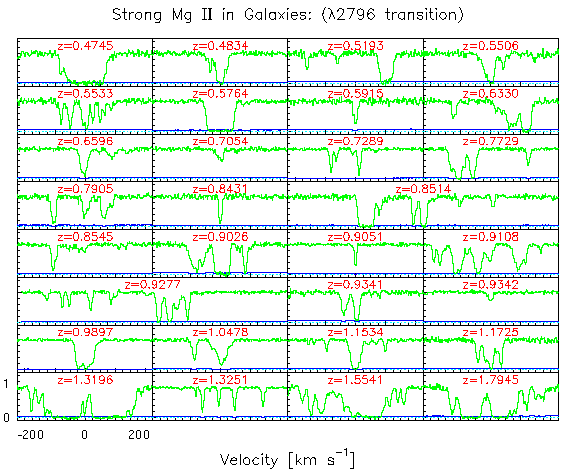
In view of the simplistic physical interpretation given above, one can
now "appreciate" the rich variation in kinematics and absorption
strengths seen in high resolution Mg II profiles (only the 2796
transition is shown).
Presented here is a gallery of Keck/HIRES Mg II 2796 Profiles (in
increasing redshift order).
Each panel is a normalized spectrum showing a rest-frame velocity
window of 480 km/s (-240 to +240 km/s), except for the z=0.8514 and
z=0.9277 systems, which show 960 km/s windows.
The typical line-of-sight velocity spread of the Mg II absorbing gas
in galaxies is 100-200 km/s.
There are a multitude of ways to numerically quantify the kinematics
of absorbing gas with each resulting in a loss of information compared
to what can be seen directly in the profiles themselves.
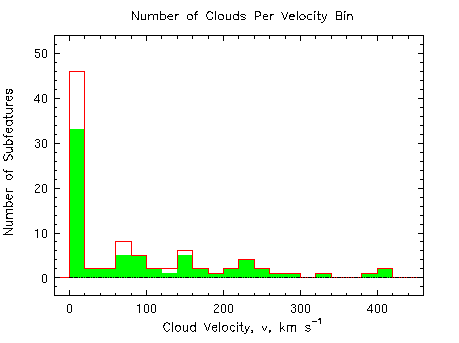
Below are shown two such indicators, the number of clouds per velocity
bin for the whole sample of 50 systems and the cloud-cloud velocity
two point correlation function (for the z < 1 systems).
| Caption: A histogram of the number of "clouds" in each 20 km/s velocity bin. The clouds are not obtained from Voigt profile fitting, but are objectively defined absorption features isolated in velocity space within a system. Taken from Churchill (1997, Ph.D Thesis) |
A velocity zero point is determined for each system by assigning v = 0 km/s at the position in the profile where the integrated optical depth is equal to either side (the optical depth median of the profile). Shown above is the resulting histogram for the full sample (red unshaded) and a subsample with limiting equivalent width detection sensitivity of 0.02 Ang (shaded green). The latter is a more accurate representation, since the former is biased against the detection of small equivalent width clouds at the higher velocities. Some systems have maximum velocity separations of 400 km/s, whereas most systems have less than 250 km/s maximum separations. There are not enough data to comment on whether the histogram actually has multiple modes (i.e. at 90, 150, and 220 km/s), but there is a slight suggestion that the kinematics are not evenly distributed in velocity for v > 20 km/s. The large signal at 0 < v < 20 km/s is not dominated by the presence of single cloud systems, it results due to the arbitrary definition of v=0 (all systems will have a cloud in this bin!). However, that the v = 0 km/s bin is so prominant and sharply drops for v > 20 km/s indicates that the bulk of the absorbing material in Mg II absorbers is confined to a narrow velocity spread (less than 20 km/s), otherwise the number of clouds would be more evenly distributed with the v > 20 km/s bins. This is a strong clue to the nature of the absorbing gas, and may suggest that the bulk of the material is in a relatively quiescent structure more akin to a galaxy disk as opposed to a full blown galactic halo (see Charlton & Churchill (1998, ApJ, 499, 181).
|
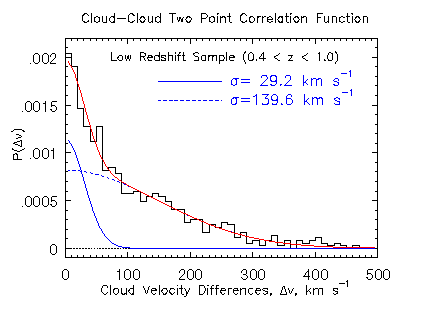
To the left is the cloud-cloud velocity Two Point Correlation Function (TPCF), which is obtained by taking the velocity differences between all cloud pairs in each system and binning them in velocity. The TPCF is one way to measure the velocity clustering properties of the clouds in intermediate redshift galaxies. Only systems with redshifts z < 1 are included (this is the redshift range over which the equivalent width distribution of the HIRES/Keck sample is consistent with an unbiased sample). |
| Caption: The cloud-cloud pair velocity separations are computed for each pair in a system, then the cummulative number in each bin are obtained over all systems to make the two point correlation function. The cloud velocities are obtained from Voigt profile decomposition of the data. Taken from Churchill (1997, Ph.D Thesis) |
A double Gaussian fit describes the TPCF quite well, with dispersions of 29 km/s and 140 km/s, respectively. Simulations were performed (Churchill 1997, Ph.D. Thesis; Charlton & Churchill 1998, ApJ, 499, 181) to ascertain if these two Gaussians are physical. For example, is the narrow Gaussian describing the cloud-cloud velocity separations in a "disk" while the broad Gaussian is describing that of the "halo". The simulations indicated that the narrow Gaussian is sensitive to the vertical velocity dispersion in disk gas, sigma_z, which is constrained to be ~15 km/s.
Voigt profiles quantify each absorbing gas cloud with a column
density, N, a Doppler parameter, b, and a velocity center. The
distribution of Mg II column densities and b parameters has been
measured before, in 30 km/s resolution spectra
(Petitjean
& Bergeron 1990, A&A, 231, 309).
With the 6 km/s resolution HIRES/Keck spectra, the distributions could
be measured not only for Mg II, but for Fe II and Mg I as well, and
with less problems from unresolved blending.
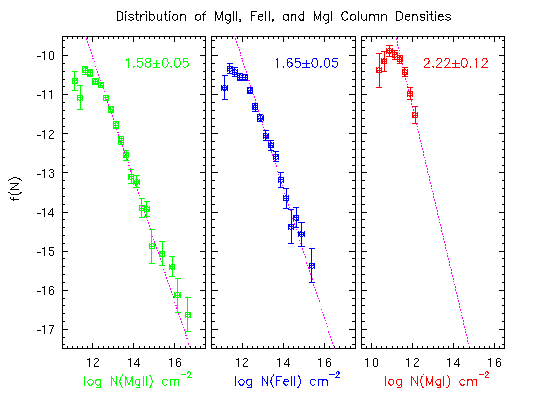
Below is shown the column density distributions for Mg II, Fe II, and
Mg I. They are all well described by a power law, with the Mg II and
Fe II distributions being consistent at the 1-sigma level. For
log[N(MgII)] > 14 cm^-2, the Voigt profile fitting becomes quite
uncertain due to saturation; this explains the increased scatter in
the data for large N(MgII). It is not clear if the distribution
actually is a single power-law over the full observed range, though
there is no obvious physical scenario to suggest the distribution
should contain a break. The same applies for Fe II. The Mg I
distribution is apparently much steeper. This is consistent with the
anti-correlation found between N(MgI)/N(MgII) and N(MgII), in that the
larger the cloud Mg II column density, the smaller the neutral
fraction of magnesium in the cloud
(Churchill 1997, Ph.D Thesis).
Also, take note that photoionization modeling with
CLOUDY
has not been able to reproduce the observed N(MgI)/N(MgII) ratios.
| Caption: The power-law differential distributions of the column densities for Mg II, Fe II, and Mg I. The fits (using maximum likelihood to the unbinned data) are drawn through the binned data. The data roll over at small column densities is due to incompleteness effects. Taken from Churchill (1997, Ph.D Thesis) |
|
The Doppler Parameter, b, measures the line widths and is obtained by
Voigt profile fitting. Assumed contributions to the line widths are
natural broadening (Lorentzian) and thermal plus turbulent broadening
(Gaussian). Convolved, these give rise to the Voigt profile. The
thermal plus turbulent broadening usually dominates so that b provides
an upper limit on the gas temperature (or is directly proportional to
the gas temperature if there is no turbulent component).
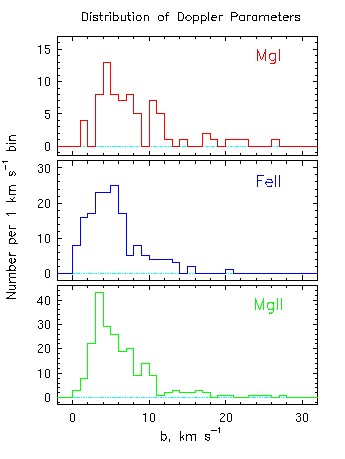
The panel to the left shows the distribution of b parameters for Mg II, Fe II, and Mg I measured in HIRES/Keck spectra (resolution ~6 km/s). The extended tails toward large b are due to line blends. The distribution for b(MgII) is most robust, given the Voigt profile fitting methodology. The mean b(MgII) is ~5 km/s, which corresponds to cloud temperatures of ~30,000 Kelvin. The resolution limit on b is 2.5 km/s, so b = 5 km/s suggests that some clouds are resolved- though blends of very narrow clouds cannot be ruled out, based upon simulations (Churchill 1997, Ph.D. Thesis). In principle, the ratio of b(FeII)/b(MgII) for each cloud can be used to "deconvolve" the turbulent component to the line broadening in the cloud. This excercise was undertaken, but based upon simulations to assess the robustness of the result, all that can claimed is that the clouds are consistent with thermal broadening (i.e. a trubulent component cannot be claimed at a signficant confidence level). |
| Caption: The Doppler parameter distributions for Mg II, Fe II, and Mg I per 1 km/s bin. These results are obtained from Voigt profile decomposition of the HIRES/Keck profiles. Taken from Churchill (1997, Ph.D Thesis) |
Based upon the redshift path density of absorbers, dN/dz, which gives
the average number of systems per unit path of redshift, the
sky-projected cross sections can be calculated for an assumed
"luminosity function" (which is taken to be the space density of
galaxies following the Press-Schecter formalism- in other words, the
absorbers are assumed to be directly associated with galaxies).
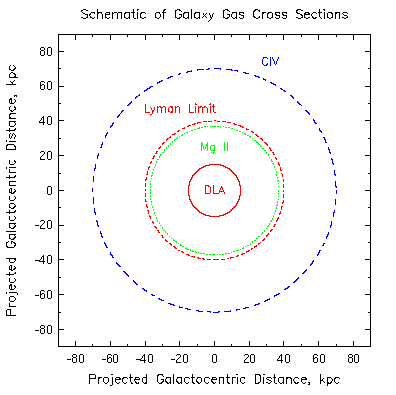
Under such assumptions, the C IV absorption-selected systems
(to rest-frame detection sensitivity of 0.4 Ang) are inferred to have
a 70 kpc size and the Mg II systems have a 40 kpc size
(detection sensitivity of 0.3 Ang).
The Lyman limit systems (those optically thick to hydrogen ionizing
radiation) have sizes comparable to the Mg II selected systems.
This led astronomers to infer that Mg II selected and Lyman limit
selected absorbers were one and the same type of object.
[We show below that this is only true for detection sensitivities of
0.3 Ang for Mg II; to a sensitivity of 0.02 Ang, Mg II systems have
a size of 60 kpc
(Churchill
et al. 1999, ApJS, 120, 51)].
The damped Lyman-alpha systems (DLAs), which always are associated
with strong Mg II absorbers, have sizes of 15 kpc.
As such DLAs were thought to be the thick disks of spiral galaxies.
However, at low redshifts (z<0.5) this has proven to be incorrect-
DLAs are observed to be associated with a wide variety of low
luminosity (~0.1 L*), morphological types
(Le
Brun et al. 1997 A&A, 321, 733), or sometimes are not even
identifiable to these limits
(Rao & Turnshek
1998, ApJ, 500, L115;
Steidel
et al. 1997, ApJ, 480, 568).
| Caption: The sky-projected cross sections of damped Lyman alpha absorbers (DLAs), Mg II absorbers, Lyman limit systems, and C IV systems are shown (in kpc, for Ho = 50 km/s/Mpc, qo = 0.5). Figure adapted from Steidel (1993). |
REFERENCES: (not on-line)
Once Mg II absorbing systems are found, deep imaging
of the quasar fields can be obtained to find candidate associated
galaxies.
Steidel,
Dickinson, & Persson (1994, ApJ, 437, L75)
performed a survey of
~30 fields, containing roughly 60 systems, and identified candidate
galaxies for virtually every absorber with W > 0.3 Ang [the
completeness limit of the survey by
Steidel
& Sargent (1992, ApJS, 80, 1)].
For 70% of the candidates, the galaxy is spectroscopically confirmed
to be at the absorber redshift.
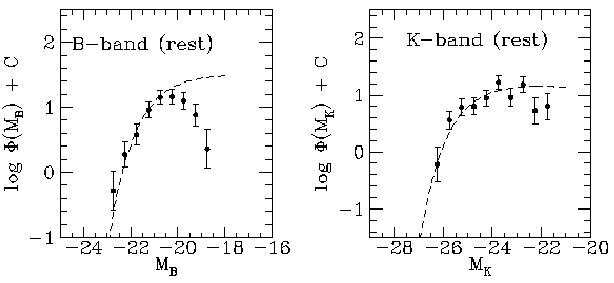
The resulting luminosity functions are shown in the figure below.
The "average" Mg II absorbing galaxy appears to be consistent with a
normal 0.7 L*(sub B) Sb galaxy having a roughly constant star
formation rate since z~1, although galaxies spanning a range of a
factor of approximately 70 in luminosity are found in the absorber
sample. The diffuse gas cross section imposed by studies of this kind
appears to be biased against the relatively underluminous, blue
galaxies which apparently dominate the number counts at faint
magnitudes.
| Caption: The rest-frame B-band and K-band luminosity functions of a sample of ~60 galaxies selected by the presence of Mg II absorption with W > 0.3 Ang. Roughly 70% of the galaxies are spectroscopically confirmed to actually have the same redshift as the absorbing gas. Taken from Steidel, Dickinson, & Persson (1994, ApJ, 437, L75). |
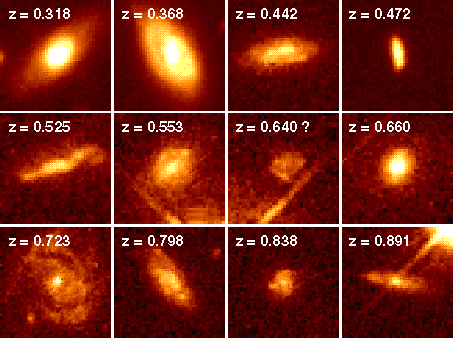
Below is a gallery of a sample of galaxies, in increasing redshift
order, that give rise to Mg II absorption. The apparent sizes of the
galaxies decrease with increasing redshift because of their relative
distances.
Note the wide variety in the apparent morphologies and orientations of
the galaxies.
In terms of the Mg II absorption selection process (for W > 0.3 Ang)
of this sample of galaxies (of which only a small subset is shown
here), it would seem that normal, bright galaxies representing a range
of galaxy types, sizes, and bulge to disk ratios, are typical.
| Caption: Hubble Space Telescope images (WFPC2) of several Mg II absorption selected galaxies. The location of the background quasar can be judged in the z=0.553, z=0.640?, and z=0.891 galaxies due to the diffration spikes. Images courtesy of Chuck Steidel. |
Yes... but only very weakly.
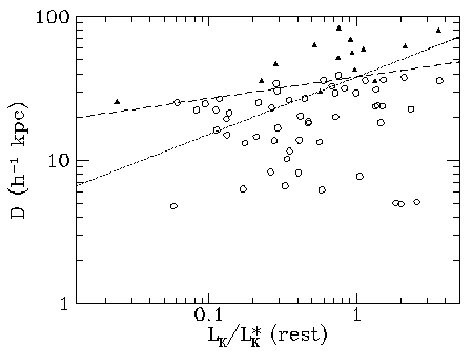
In the figure below, we show the impact parameter, D, vs. the rest-frame
K-band luminosity of galaxies in quasars fields, as presented by
Steidel
(1995, astro-ph/9509098).
The open circles are Mg II absorption selected galaxies with W > 0.3
Ang.
The solid triangles are non-absorbing galaxies in the quasar fields.
A "Holmberg" relation is shown (L^0.4 dependence) as a dotted line,
normalized at D = 38 kpc at L/L* = 1.
The dashed line is obtained by minimizing the number of non-absorbing
galaxies below the line and the number of absorbing galaxies above the
line.
This yielded a weak Holmberg relation for the gas cross section as a
function of galaxy luminosity, L^0.15.
This has been interpreted as evidence that the gas is distributed in
spherical halos with sharp cut-offs (at W = 0.3 Ang) and unity
covering factors.
| Caption: The impact parameter, D, vs. the rest-frame K-band luminosity of galaxies in quasars fields. See text for details. Taken from Steidel (1995, astro-ph/9509098). |
The above interpretation, however, is not unchallenged. Charlton & Churchill (1996, ApJ, 465, 631) showed that the cross sections of the galaxy disks (once they are not assumed to be gossimer thin, but given realistic thickness), are competitive with that of spherical geometry. They performed a Monte Carlo survey of QSO fields in which the model galaxies have Mg II absorbing "clouds" in spherical halos or in randomly oriented disks. For both geometries, models that recover the observed properties of Mg II absorbers have only a 70%-80% covering factor. Therefore, regardless of absorber geometry, a survey of randomly selected QSO fields should yield a nonnegligible number of non-absorbing galaxies at small impact parameters. As shown below, few have been observed. However, based upon further modeling, Charlton & Churchill find that the selection techniques employed by Steidel, Dickinson, & Persson (1994, ApJ, 437, L75) may have played an important role in yielding a small number of small impact parameter, non-absorbers. If so, this could render the spherical halo interpretation as non-unique.
Yes and No.
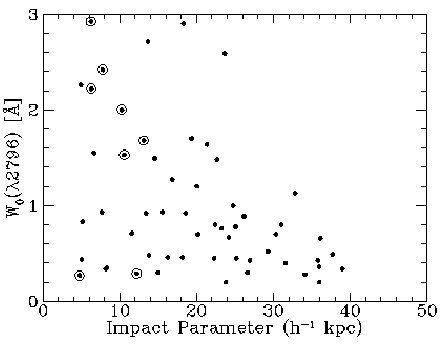
As can be seen in the figure below, there is a 3.8-sigma
anti-correlation between the Mg II 2796 rest-frame equivalent width, W,
and the quasar-galaxy impact parameter, D (in kpc, for Ho = 50
km/s/Mpc, q0 = 0.5).
Note however that this is dominated by the relatively rare, very
strongest absorbers and damped Lyman alpha absorbers (data points with
concentric circles) at small impact parameters.
For W <= 1.0 Ang, there is no trend.
This provides evidence that the Mg II absorbing gas distribution
around galaxies is patchy and not smoothly distributed (see below).
| Caption: The Mg II 2796 rest-frame equivalent width vs quasar-galaxy impact parameter for the absorber-galaxy sample of Steidel, Dickinson, & Persson (1994, ApJ, 437, L75). Data points with open concentric circles are damped Lyman alpha absorbers (DLAs). Taken from Steidel (1995, astro-ph/9509098). |
A long-standing question has been "What is the spatial and kinematic
structure of the extended gas surrounding intermediate redshift
galaxies?".
Early results based upon small, incomplete samples
were suggestive that the gas followed an fairly smooth inverse
square density law
(Lanzetta
& Bowen 1990, ApJ, 357, 321)
and that the kinematics were systematic in that at small quasar-galaxy
impact parameters, D, the gas showed disk-like rotation kinematics and
at larger impact parameters showed infall-like kinematics
(Lanzetta
& Bowen 1992, ApJ, 391, 835).
In a larger and complete, but still small sample,
Churchill,
Steidel, & Vogt (1996, ApJ, 471, 164)
showed that the spatial distribution was not smooth and that the
kinematics did not follow any simple systematic trend.
They searched for correlations between the Mg II absorption properties
(kinematic spreads, profile asymmetries, number of subcomponents,
and total equivalent widths) and the galaxy properties (L and B
luminosities, impact parameters, and B-K colors).
Unlike the Lanzetta & Bowen samples, the Churchill et al. sample
revealed no significant correlations between any combination of
properties.
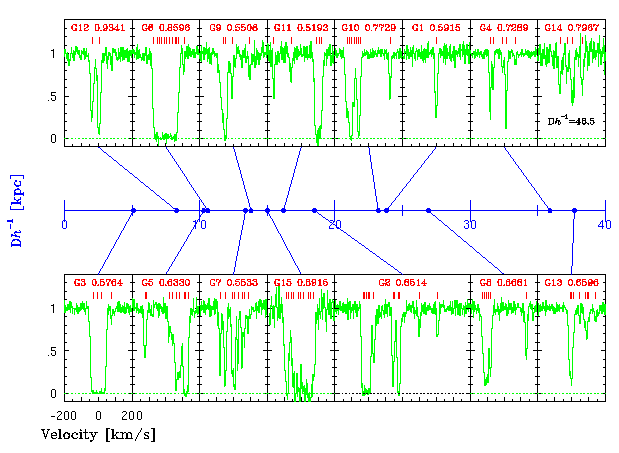
The figure below shows the HIRES/Keck profiles from their sample
ordered with increasing impact parameter.
Note the lack of any visual trend.
| Caption: The Mg II 2796 profiles in rest-frame velocity as a funtion of the quasar-galaxy impact parameter, D (in kpc, for Ho = 50 km/s/Mpc, qo = 0.5). Ticks above the spectra give the number of subcomponents ("clouds") and their velocity centers as determined using Voigt profile fitting. The labels give the galaxy ID and redshift as published in Churchill, Steidel, & Vogt (1996, ApJ, 471, 164). |
A statistical study of how galaxy morphology and Mg II kinematics are
connected (if at all) has not yet been performed. Some data do exist
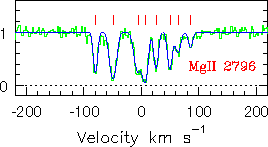
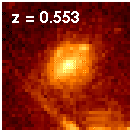
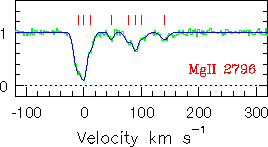
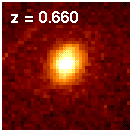
for such a study. Below are shown the Mg II 2796 absorption profiles
(Churchill 1997, Ph.D. Thesis)
in line of sight velocity (v = 0 set by the optical depth median of
the profile) and the HST images of the associated galaxies
(courtesy of Chuck Steidel).
These ~2" postage-stamp size images are centered on the galaxies- the
background quasars lie between 2" and 10" outside the images.
That is, the absorbing gas lies well outside the apparent stellar
component of the galaxies.
Based upon recent results by Churchill et
al. (1999a,b ApJ, submitted)
and
Churchill
& Charlton (1999,
AJ, 118, 59), it is very likely that the Mg II absorption in and
of itself will not reveal any fundamental results, but that high
ionization absorption (i.e. C IV, N V, and O VI) and the neutral
hydrogen, H I, will need to be fully incorporated into any study of
relationships between absorbing gas properties and galaxy morphologies
(see below).
Redshift z=0.553 (Q1148+384). A Face-on Spiral at D=15 kpc.
Redshift z=0.660 (Q1317+317). A Face-on S0 at D=21 kpc.
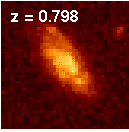
Redshift z=0.798 (Q1622+238). An Inclined Spiral at D=46 kpc.
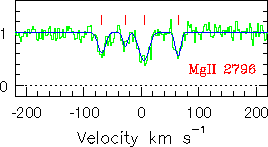
| Caption: The Mg II 2796 absorption profiles (resolution 6 km/s FWHM) are shown next to close-up (~2" on a side) HST images of the associated galaxies, whose morphologies and sky orientations can be clearly discerned. The histogram curves are the observed data and the smooth curves through the data are the Voigt profile model spectra. Ticks above the spectra give the number and velocity centroids of the Voigt profile components of the gas. |
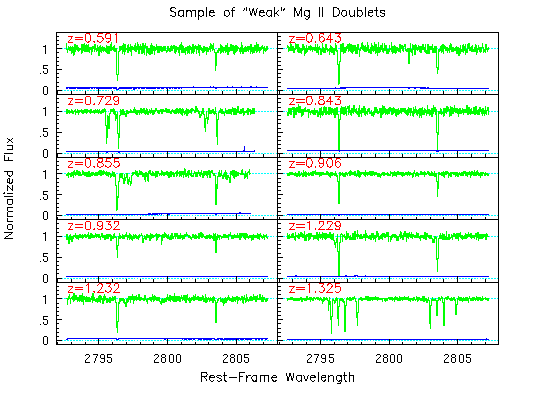
A gallery of a sample of weak Mg II doublets are shown in the figure below.
The data are converted to rest-frame wavelengths with their redshifts
labeled in red. Note that the profiles are, for the most part,
comprised of unresolved subcomponents (resolution = ~6 km/s), even
when multiple components are present. If you would like to view all
30 systems click here.
Since ~1990, based upon statistical arguments and upon photoionization
modeling, several researchers suggested that very small equivalent width Mg II
did not exist. With the advent of very high signal to noise and high
resolution spectroscopy the
detection threshold dropped significantly below the the previous
sensitivity levels of 0.3 Ang and the supposition could be tested
directly by observations
(Tripp,
Lu, & Savage 1997, ApJS, 112, 1
;
Churchill
et al. 1999, ApJS, 120, 51).
Weak Mg II absorbers, then, are simply those having equivalent widths
less than 0.3 Ang.
In an unbaised survey for weak systems in 26 quasar lines of sight
covering redshifts 0.4 to 1.4, Churchill et al. discovered 30 such
systems and were able to measure the statistical properties of this
sub-population of Mg II system.
The redshift path density, dN/dz, is a factor of three times greater
than that of the stronger systems!
This implies very large sizes, roughly 65 kpc, if the weak absorbers
are also associated with the same population of galaxies as are the
strong ones (however, see below).
| Caption: Representative "weak" Mg II absorbers as seen in HIRES/Keck spectra (Churchill et al. 1999, ApJS, 120, 51). |
Shown in the top panel below is a grid of
CLOUDY
photoionization
models. The important quantities characterizing the "clouds" are the
total hydrogen column density, N(HI)+N(HII), shown across the
horizontal axis, the observed Mg II column density, N(MgII), shown
along the vertical axis, the neutral hydrogen
column density, log[N(HI)], shown as solid green lines, and
the ionization parameter, log(U) =
log(n_ph/n_H), shown as dotted blue lines, where n_ph is the
number density of hydrogen ionizing photons (lambda < 912 Ang), and
n_H is the number density of hydrogen.
It is assumed that the source of photons is the UV background from
quasars and active galactic nuclei at z=1, as calculated by
Haardt
& Madau (1996, ApJ, 461, 20), and that the metallicity of the
clouds is 0.1 of the solar value. The downward
red arrow shows how the grid moves if the metallicity is
decreases by 1 dex.
The larger the ionization parameter, the higher the ionization
condition in the cloud.
Optically thick clouds are those having log[N(HI)] > 17.3 cm^-2.
The yellow region is gives the range of observed N(MgII) for the
sample of Churchill et al., based upon Voigt profile fitting.
If weak Mg II systems are in photoionization equilibrium, it can be
inferred that they are optically thin to hydrogen ionizing photons
and that their metallicities must be no less than 0.1 of the solar
value, on average
(Churchill
et al. 1999, ApJS, 120, 51).
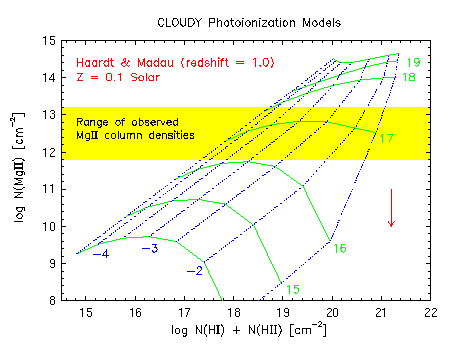 Caption: A grid of photoionization models showing that most weak Mg II systems arise in optically thin gas (see text above for details). Taken from Churchill et al. (1999, ApJS, 120, 51). |
In the photoionization grid above, note that much of the N(HI) range
corresponds to the observed range of N(MgII) is in the regime of
optically thin gas. This inferrence is also supported by simple
arguments based upon a comparison of the redshift path densities, dN/dz, of
optically thick, Lyman limit systems (LLS) and the weak Mg II systems.
In the left-hand panel below, these quantities are shown for a mean
redshift of
Returning to the photoionization grid above, we now see that the
metallicities must be 0.1 solar or higher on average, since lower
metallicity clouds require greater N(HI) for the measured N(MgII).
This can be seen visually by moving the grid
downward (as indicated by the red arrow) as metallicity is increased
in the models.
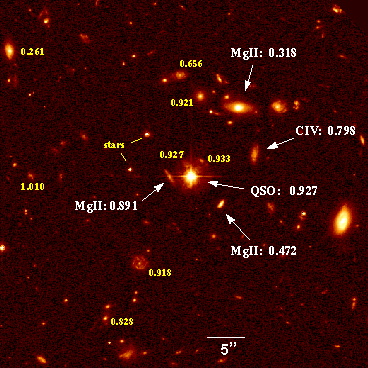
As an example of the "missing luminous counterparts" to weak systems,
an HST
image of the Q0002+051 is shown below with the Mg II absorbing galaxies
highlighted. This field has been studied
intensively, with spectroscopic confirmation of all objects within 20"
of the quasar down to L < 0.05L* in the rest-frame of the objects
(C. Steidel, private
communication).
Note that there are no candidates for the two weakest systems (the
z=0.592 system is techinically a weak system with W = 0.29 Ang, but is
right on the admittedly arbitrary demarcation line defining them).
Most intriguing are the set of data points in panel b that fall
well below the correlation line in the velocity region 40-60 km/s
(four are limits and one is a "low C IV" DLA).
These systems can be thought of as being of "C IV-deficient" in the
context of their other properties being similar to systems with
stronger C IV absorption.
See
Churchill
et. al. (1999, ApJ, 519, L43) and
Churchill et al. (1999a,b ApJ,
submitted)
for further details.
Implications:
These results have been interpreted by Churchill et al. to be
suggestive of multiphase ionization conditions (also supported by
detailed photoionization modeling, which showed that the C IV and Mg II
absorption strengths often cannot be explained as ionization balance
in single phase absorption clouds). There also seems to be two types
of large W(2796) systems, DLAs and "doubles". The doubles are marked
by large kinematic spreads and strong W(1548), whereas the DLAs have
intermediate velocity spreads (30-60 km/s) and intermediate W(1548).
This may be indicating that DLAs have C IV structures comparable to
the "typical" Mg II absorber (i.e they are not unique to the DLA
class) and that very strong W(1548) may signify a large kinematic
spread in the Mg II gas.
Churchill et al. (1999b, ApJ, submitted)
applied a
multivariate
clustering analysis
to 45 system and found five
natural groupings, or "classes" of Mg II selected absorbers.
They called these classes: (1) DLA/HI-Rich, (2) Double, (3) Classic,
(4) CIV-deficient, and (5) Single/Weak.
The mean properties of these classes (color coded and labeled) are
shown in the top panel of the figure below. The lower panel shows the
data for a representative member of each class with the data aligned
vertically across panels.
Caption:
A K-means clustering diagram showing the mean properties of
each of the five classes. For the analysis, the data were N(0,1)
standardized (means set to zero and normalized by standard
deviations).
To the left are the aborption profiles for a represntative member of
each class. A brief description of the characrterizing properties, as
shown in the K-means diagram and as seen in the profiles, is discussed
in the table below.
Caption:
Examples of the five taxonomic classes of Mg II selected systems
when Mg II, Ly-alpha, C IV, Fe II, and Mg II kinematics are included
in the analysis. Ticks above the data give the number and velocities
of the Voigt profile components. For C IV, both members of the
doublet are shown.
Since the Classic systems have very average, if not "defining"
properties for Mg II systems (as classically measured in low
resolution spectra), it is convenient to compare the properties of the
other four classes in terms of the those of the Classics. Below is a
table presenting a crude description and comparison of the five
classes yielded by the multivariate clustering analysis.
The conclusions presented below also draw upon
CLOUDY
photoionization modeling [see
Churchill
et al. (1999, ApJS, 120, 51);
Churchill et al. (1999b, ApJ,
submitted);
Rigby, Charlton, & Churchill
(2000, in prep)].
We caution that the classification scheme introduced above should
not be taken to suggest that Mg II absorbers group into discretized
classes.
Discretization is a byproduct of clustering analysis.
In fact, the distribution functions of the equivalent widths
are characterized by single modes and decreasing tails.
The exceptions are the Mg I, Fe II, and Lyman-alpha equivalent widths,
which are bimodal due to the DLA/HI-Rich class.
As such, any single absorption property, viewed in this univariate
fashion, is distributed continuously.
However, from the perspective of a multivariate analysis, it is clear
that the overall properties of Mg II absorbers group in well defined
regions of a "multi-dimensional space".
Interpretation of the clustering results ultimately must be tied
into the issue of whether there is a systematic connection with the
environments in which the various classes arise.
Here we see that W(CIV) is not related to W(MgII) as much as it is
related to the kinematic "morphology" of the Mg II absorption.
A key ingredient driving the presence of large W(CIV) appears to
be the presence of small clouds at large velocities.
Note, for example, how the DLA/HI-Rich systems have large W(MgII) but
exhibit simple kinematics (back-bottomed saturation and no higher
velocity material).
If the W(CIV) correlation with Mg II kinematics is relatd to the
presence of small W(MgII) clouds at larger velocities, it might be
inferred that these "outlier" clouds are highly ionized [this the
small W(MgII) and large W(CIV)]. In other words, that the strong C IV
is due to ionization balance in clouds that are spread out in
velocity.
However, when
CLOUDY
photoionization models of these systems are investigated, the large
W(CIV) cannot be accounted for even under the assumption that the gas
is as highly ionized as is allowed by the constraints from the low
ionization data (chiefly Fe II and Mg II).
The equivalent widths of these small clouds are too small to be
arising in high ionization gas under the assumption of solar or
subsolar metallicities in the clouds.
See
Churchill
et al. (1999, ApJS, 120, 51),
Churchill
& Charlton (1999,
AJ, 118, 59),
and
Churchill et al. (1999b, ApJ, submitted)
for details.
Therefore, it is concluded that the bulk of the C IV gas arises in a
higher ionization phase physically distinct from that giving rise to
the Mg II absorption.
This suggests a physical connection between the presence of these
small clouds in the facinity of a galaxy and a high ionization
structure, perhaps a corona structure not to unlike the one seen
around the Milky Way.
Arguably, the Mg II selected systems are ideally
suited for a tour de force study because
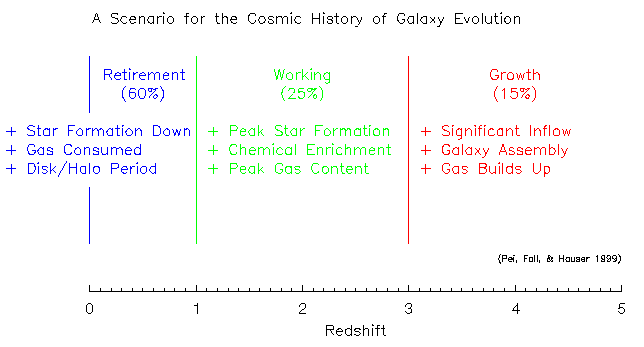
As seen in the figure below, Pei et. al. identify three phases to
galaxy evolution: a
growth period of
gaseous infall at z > 3,
a working period
marked by higher levels
of star formation from 1 < z < 3, and a
retirement period
when star formation
diminishes as gas is no longer replenished into the galaxies at z < 1.
The percentages below each of the three phases gives the approximate
fraction of cosmic time over which the galaxies evolve in each phase.
The redshift scale is given along the horizontal axies in the lower
panel, which shows the redshift intervals and equivalent width
detection limits (sensitivities) over which Mg II absorption surveys
have been conducted.
Note that the
retirement period,
from z =
1, comprises over 50% of the epoch of galaxy evolution. It is
important to note that the scenario is not well constrained by the
data for z > 3. It could be that the
growth period
terminates at a higher redshift.
Having motivated Mg II absorption selected systems as the best suited
for providing a absorption line database for constraining models of
galaxy evolution (see above), we can now ruminate on what the
absorption line signatures will be in the context of models such as
that presented by
Pei,
Fall, & Hauser (1999, ApJ, 522, 604).
The growth period would be the
epoch when galaxies accreted truly intergalactic gas and/or
proto-galactic clumps (PGCs)
[e.g.
Rauch,
Haehnelt, & Steinmetz (1997,ApJ, 481, 601)].
Note that this redshift regime and epoch of galaxy evolution remains
unexplored in Mg II absorption!
The working period
would be the epoch when galaxies have decoupled
from the filamentary flow and PGCs were no
longer abundant as fundamental building blocks, but galaxies continue
to accrete local material at high mass-transfer rates [i.e. bound
"satellite" objects
(York
et al. 1986, ApJ, 311, 610)
ergo the supply of material for continued star formation].
This period would then be distinguished by having a large fraction of
Mg II absorbers with profiles similar to those presented in yellow
shaded region outside the upper right of the W(CIV) vs. W(MgII) plane
(shown above).
Note that the upper half of this redshift regime and epoch of galaxy
evolution remains unexplored in Mg II absorption and is virtually
unexplored at high resolution!
The retirement period,
which roughly corresponds to the lower range of
the intermediate redshift regime studied with this work, would be
the epoch when the number of galaxy mergings and satellite accretions
have diminished to the point that the cosmic star formation rate diminishes.
The complex Mg II aborption profiles with multiple velocity splittings
and lower total optical depths would then be a reflection of the
reduced gas mass.
This would imply that a majority of galaxies transform into
self-regulatory systems by z~1 and begin to evolve in
a more isolated fashion and in a direction dependent upon their
ability to continue forming stars.
Galaxies that were rich in gas and were capable of forming large
numbers of molecular clouds in their interstellar media (i.e.
late-type galaxies) would continue to form stars and exhibit
evolution, whereas those less capable would exhibit no discernable
evolution.
Such a scenario is consistent with the differential luminosity
evolution reported by
Lilly
et al. (1995, ApJ, 455, 108).
UNDER CONSTRUCTION...
Caption:
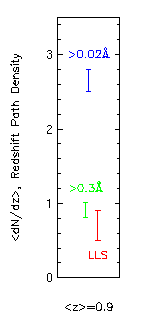
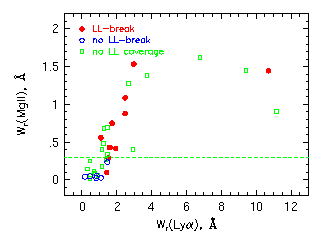
(left)- The redshift number density of Lyman limit systems (LLSs),
strong Mg II systems (green), and all Mg II systems including weak
systems (blue).
Taken from
Churchill
et al. (1999, ApJS, 120, 51).
(right)- The Mg II - Ly-alpha equivalent width plane
showing the optically thick (red) and
optically thin (blue) systems.
Taken from Churchill
et al. (1999a, submitted).
It is hard to be conclusive about this issue at this time, however,
there is mounting evidence that the weakest of the weak systems
are not near normal, bright (L > 0.05L*) galaxies .
Out of the 30 systems with W < 0.3 Ang reported by
Churchill
et al. (1999, ApJS, 120, 51), 12 have no apparent associated
galaxy, 3 have confirmed galaxy hosts, 3 have candidate galaxy hosts
(C. Steidel, private
communication), and 12 are undetermined (i.e. there are
no imaging data of the fields).
The most extensive search so far was conducted on the two weak systems
in the Q0454+039 field at z=0.6428 and z=0.9315 by
Churchill
& Le Brun (1997, ApJ, 499, 677), who studied a deep HST
image of the field with follow up spectroscopy on the objects in the
field. No galaxy candidates were found to m=24.
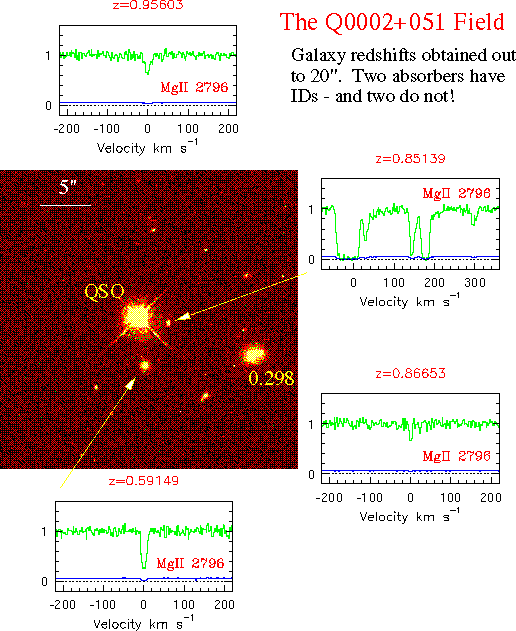
Caption:
An HST image of the UM 18 (0002+051) quasar field showing the
galaxies identified with the Mg II absorbers at z=0.851 and z=0.592 (and a
third at z=0.298; spectrum not shown). There are two weak Mg II
systems that are apparently not associated with bright galaxies (L >
0.05L*) within 20" of the quasar. Image taken from the HST
archive at STScI and spectra taken
from
Churchill (1997, Ph.D. Thesis)
and
Churchill
et al. (1999, ApJS, 120, 51).
Since the resonant C IV 1548, 1550 doublet is also a clearly
detectable feature in quasar spectra, and since it often samples an
ionization phase of significantly lower density (or ionization level)
than sampled by the Mg II doublet, a direct comparison can be made of
these two gas tracers. Unfortunately, for the intermediate redshifts
studied here ( z = 0.4 - 1.4 ), high resolution spectra are not
available in the ultraviolet, where the C IV transition is observable.
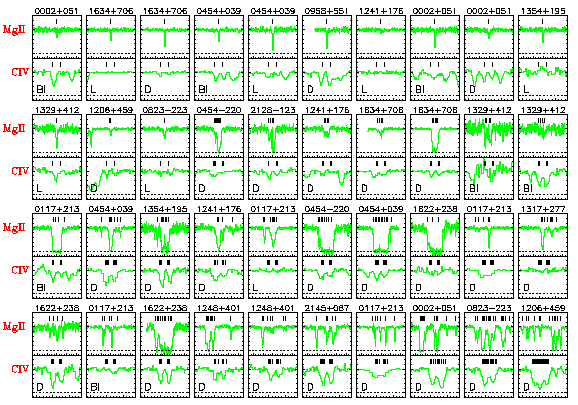
Below is shown a gallery of the expected locations in HST/FOS
spectra (resolution ~230 km/s; lower sub-panels) corresponding to the
Mg II 2796 absorption (resolution ~6 km/s; upper sub-panels). Note
that both members of the C IV doublet are
shown over a velocity window of 2400 km/s, whereas only the 2796
transition is shown for the Mg II profiles over a velocity window of
480 km/s. Ticks above the Mg II data give the number of Voigt profile
components and their velocity centers.
A "Bl", "L", or "D" in the C IV panels indicated whether
the location of the doublet was blended with another feature, was not
detected with no blend (a limit), or was detected, respectively.
The systems are order from left to right and top to bottom in order of
the increasing "kinematic spread" of the Mg II 2796 profile. The
kinematic spread, omega_v, is the second velocity moment of the
optical depth across the profile.
See
Churchill
et. al. (1999, ApJ, 519, L43) for further details.
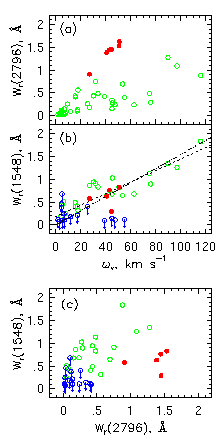
The equivalent widths of the above data are plotted to the left.
Open green data are those systems with C IV
detections, red data are damped
Lyman-alpha absorbers (DLAs), and blue
open data are upper limits for the C IV equivalent width.
The most stricking aspect of these diagrams is the apparently very
tight correlation between the W(1548) and the Mg II
kinematic spread (panel b).
Two maximum likelihood linear fits are shown, one forced through the
origin.
Note that the W(2796) is also
correlated, as expected, but not tightly.
Also note that W(1548) and W(2796) are not correlated tightly, with
the DLAs giving rise to the dramatic spread at the largest W(2796).
Churchill et al. (1999b, ApJ, submitted)
analyzed 45 Mg II absorbing systems for which they had measured the
far UV transitions in 18 HST FOS spectra
(Churchill et al. 1999a, ApJ,
submitted).
Equivalents widths or detection limits for H I (using Lyman-alpha) and
C IV were obtained form almost all systems.
These two species represent the two other classes of absorption
selected systems (i.e. Lyman alpha forest, Lyman-limit, damped
Lyman-alpha, and C IV systems; click here for more details on these classes),
and are thus particularly interesting for contrasting these properties
in Mg II selected systems.
In HIRES/Keck spectra, the Mg II and Fe II equivalent widths and Mg II
kinematic spreads are robustly measured (Churchill, 1997, Ph.D. Thesis).
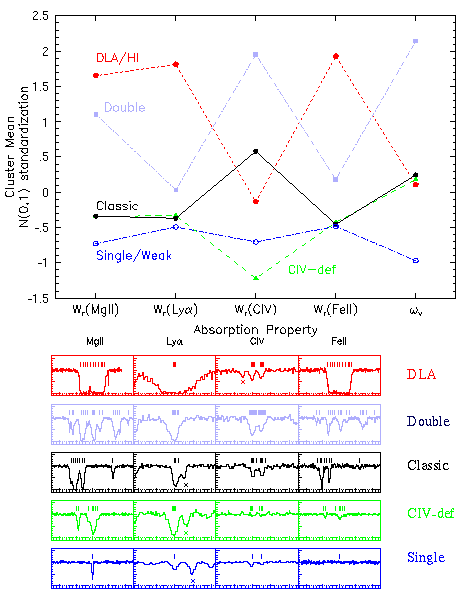
Consider each systems as a data point in a five dimensional space
[W(MgII), W(Lya), W(CIV), W(FeII), and omega_v; where the latter is
the "kinematic spread"].
A
K-means
analysis
is used to find the minimum number of statistically
significant clusters, by minimizing the "distances" between members
within a cluster and maximizing the "distances" between the means of
the clusters.
Table of Taxonomic Properties
Class
Mg II
H I
C IV
Fe II
DLA/HI-Rich
Black bottom saturation; velocity spreads similar to Classics- narrow
range of 40-60 km/s.
Very large W(Lya), some due to damping wings, others on log part of the curve
of growth; not all of them have N(HI)>2e20.
On average, they are not CIV deficient, but less than Classics; in separate,
higher ionization phase which is small compared to Classics (perhaps
due to kinematics).
Black bottom saturation; W(FeII) and W(MgII) roughly equal and large.
Double
W(MgII) large, but less than DLAs; large kinematic spread with high level of
complexity and range in cloud sizes.
On average, W(Lya) larger than for Classics due to kinematic
broadening, often arising in higher ionization phase.
Very large compared to all other classes; correlated to MgII
kinematic spread; arises in separate, higher ionization phase.
On average, stronger than for Classics; arises in strongest MgII
clouds.
Classic
Average W(MgII) and kinematics; often have small clouds at large
velocities.
Average W(Lya); almost always a Lyman limit system
Average W(CIV); often arises in separate high ionization phase (not
photoionization balance in MgII clouds).
Average W(FeII); correlated to W(MgII) with large scatter.
C IV - deficient
Similar to Classics; not marked by small clouds at large velocity.
Similar to Classics; Some are Lyman limit systems, some are not.
On average, 2-sigma below mean of Classics; apparently are lacking a
kinematically broadened, separate high ionization phase.
Similar to Classics.
Single/Weak
Single, narrow, unresolved clouds. (ASIDE: apparently not
associated with normal, bright galaxies.)
On average, W(Lya) smaller than Classics and CIV deficient, but wide
variation due to presence of separate, higher ionization phase with C
IV in some; None are Lyman limit systems.
Mean below classics, but show full range in W(CIV), but none as large
as for Doubles; presence of CIV and of FeII in same cloud due to
separate ionization phases.
About half of the population has N(FeII) roughly equal to N(MgII),
though small; Signifies low ionization (high density), small (10s of
pc!) clouds.
The strong correlation between the C IV equivalent width, W(CIV), and
the kinematic spread and complexity of Mg II absorption is illustrated
in the figure below, which is the W(CIV) vs. W(MgII) plane, but with
the Mg II 2796 profiles (HIRES/Keck) plotted at their respective
W(CIV) - W(MgII) locations.
Additionally, the large range of W(CIV) for the Single/Weak systems,
and the smaller W(CIV) for the DLA/HI-Rich systems can be seen.
This figure is to be compared with ( panel c ) of the lower
figure in the section entitled "How Does C IV Absorption Correlate
with Mg II Kinematics?".
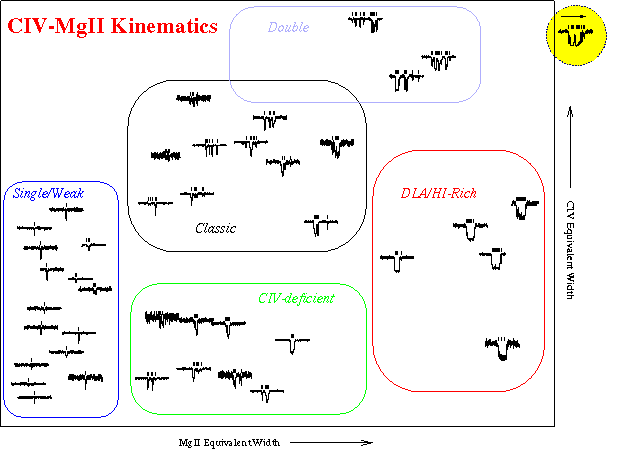
Caption:
The "W(CIV) vs. W(MgII) plane" with the Mg II 2796 profile (HIRES/Keck)
of each system plotted at its location in this plane. The five
taxonomic classes (see above) separate out on this plane and are
identified with the color-coded outlining boxes.
Adapted from Churchill et al. (1999b, ApJ,
submitted). The system encircled in yellow at upper right is a
higher redshift system (only z = 0.4 - 1.4 is represented here).
Several very large W(MgII) systems at higher redshifts have this
profile morphology. Since these systems evolve away from z=2 to z=1,
it suggests that there is evolution on the W(CIV) vs. W(MgII) plane
and that this is also connected to the Mg II kinematics.
If we are to use quasar absorption lines as a technique for
understanding galaxy evolution, we must first accept the premise
that an observational database of the gaseous components of galaxies
is as effective as one of the stellar components for placing
constraints on models, scenarios, and theories of global galaxy evolution.
Second, we then need to identify which types of
systems to select (e.g. Lyman-limit, DLA, Mg II, or C IV selection,
etc.).
This decision should be based upon the simple criteria:
Consider the following observational facts over the cosmic epoch
probed by the existing Mg II absorber samples:
These observations are somewhat suggestive of a causal connection
between evolution in the cosmic star formation rate and absorbing gas
cross sections, kinematics, and ionization conditions in Mg II absorbers.
If so, we could hypothesize that scenarios of a cosmic mean history of
galaxy evolution inferred from the global record of star formation
history should be fully consistent with one based upon an "absorption
line perspective".
It is unfortunate that there currently are no Mg II absorption-line
samples for the highest redshifts (z > 3), so an absorption line
perspective cannot yet be fully appreciated (however, see
Rauch,
Haehnelt, & Steinmetz 1997, ApJ, 481, 601).
Interestingly, the global galaxy evolution models, like those of
Pei,
Fall, & Hauser (1999, ApJ, 522, 604),
which are constrained, to a large part, by the cosmic star formation
history, may provide insights to what the absorption line data will
reveal.
There are several models of global galaxy evolution and each provide a
roughly similar scenario for the evolution of galaxies from the
highest redshifts (now up to z~4).
A nice, heuristic model has been presented by
Pei,
Fall, & Hauser (1999, ApJ, 522, 604),
and we use this model to motivate the next section on understanding
galaxy evolution from an absorption line perspective.
Caption:
NOT COMPLETE.
Our current knowledge base of Mg II absorption stops at z = 2.2 and
this is at a relatively low sensitivity level in low resolution spectra.
The kinematics and cloud velocity splitting have been observed only
from 0.4 < z < 1.4.
Why, we go out and observe Mg II absorption over the full redhsift
range of evolution, of course!
UNDER CONSTRUCTION...
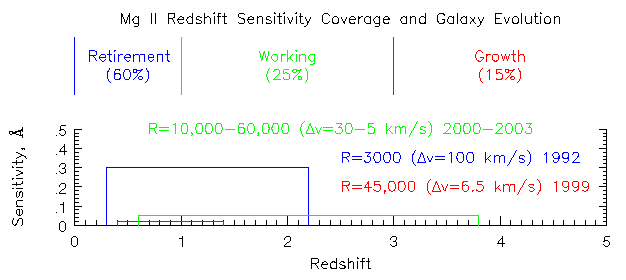
Caption:
NOT COMPLETE.
Our current knowledge base of Mg II absorption stops at z = 2.2 and
this is at a relatively low sensitivity level in low resolution spectra.
The kinematics and cloud velocity splitting have been observed only
from 0.4 < z < 1.4. In the future, infrared spectroscopy will allow
us to observe Mg II absorption to high sensitivity out to z ~ 4. The
years over which the data were obtained (or will be obtained) are
given to the right of the survey legends.
This page maintained by Chris Churchill cwc@astro.psu.edu:
If you have comments or questions please feel free to email me.

