Bolshoi Cosmological Simulation
|
Bolshoi Cosmological Simulation |
Initial conditions | |||||
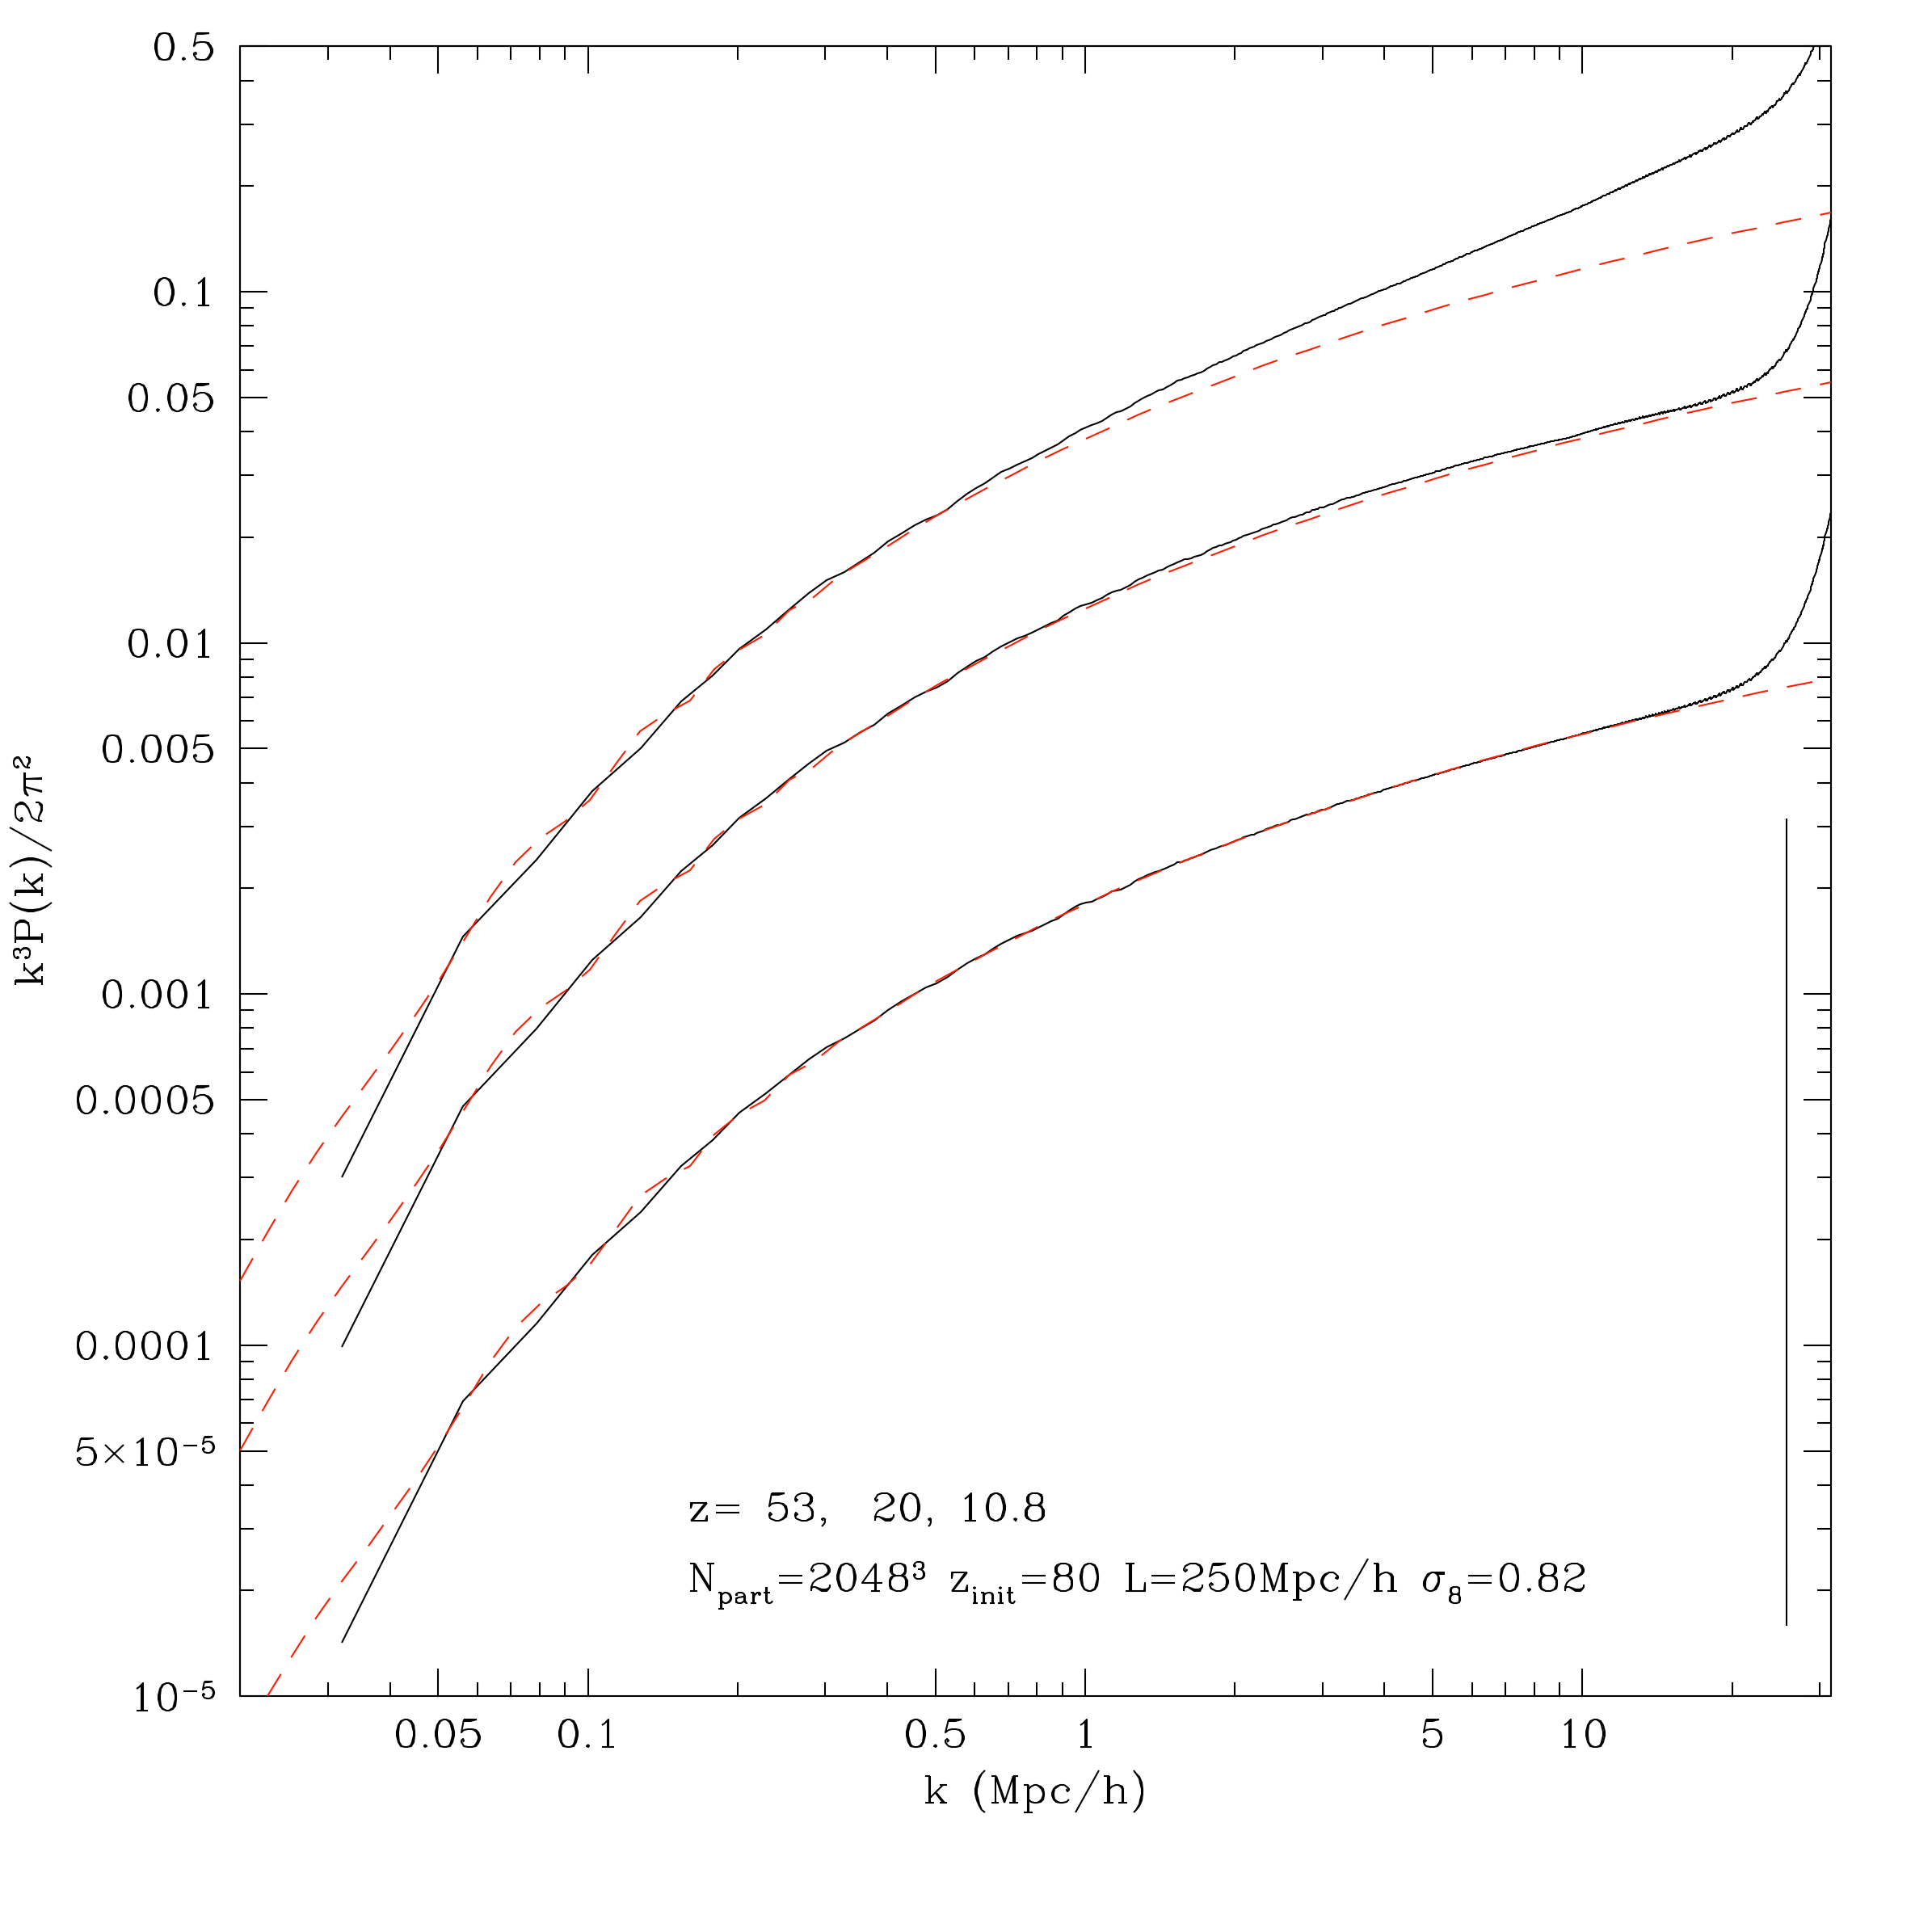
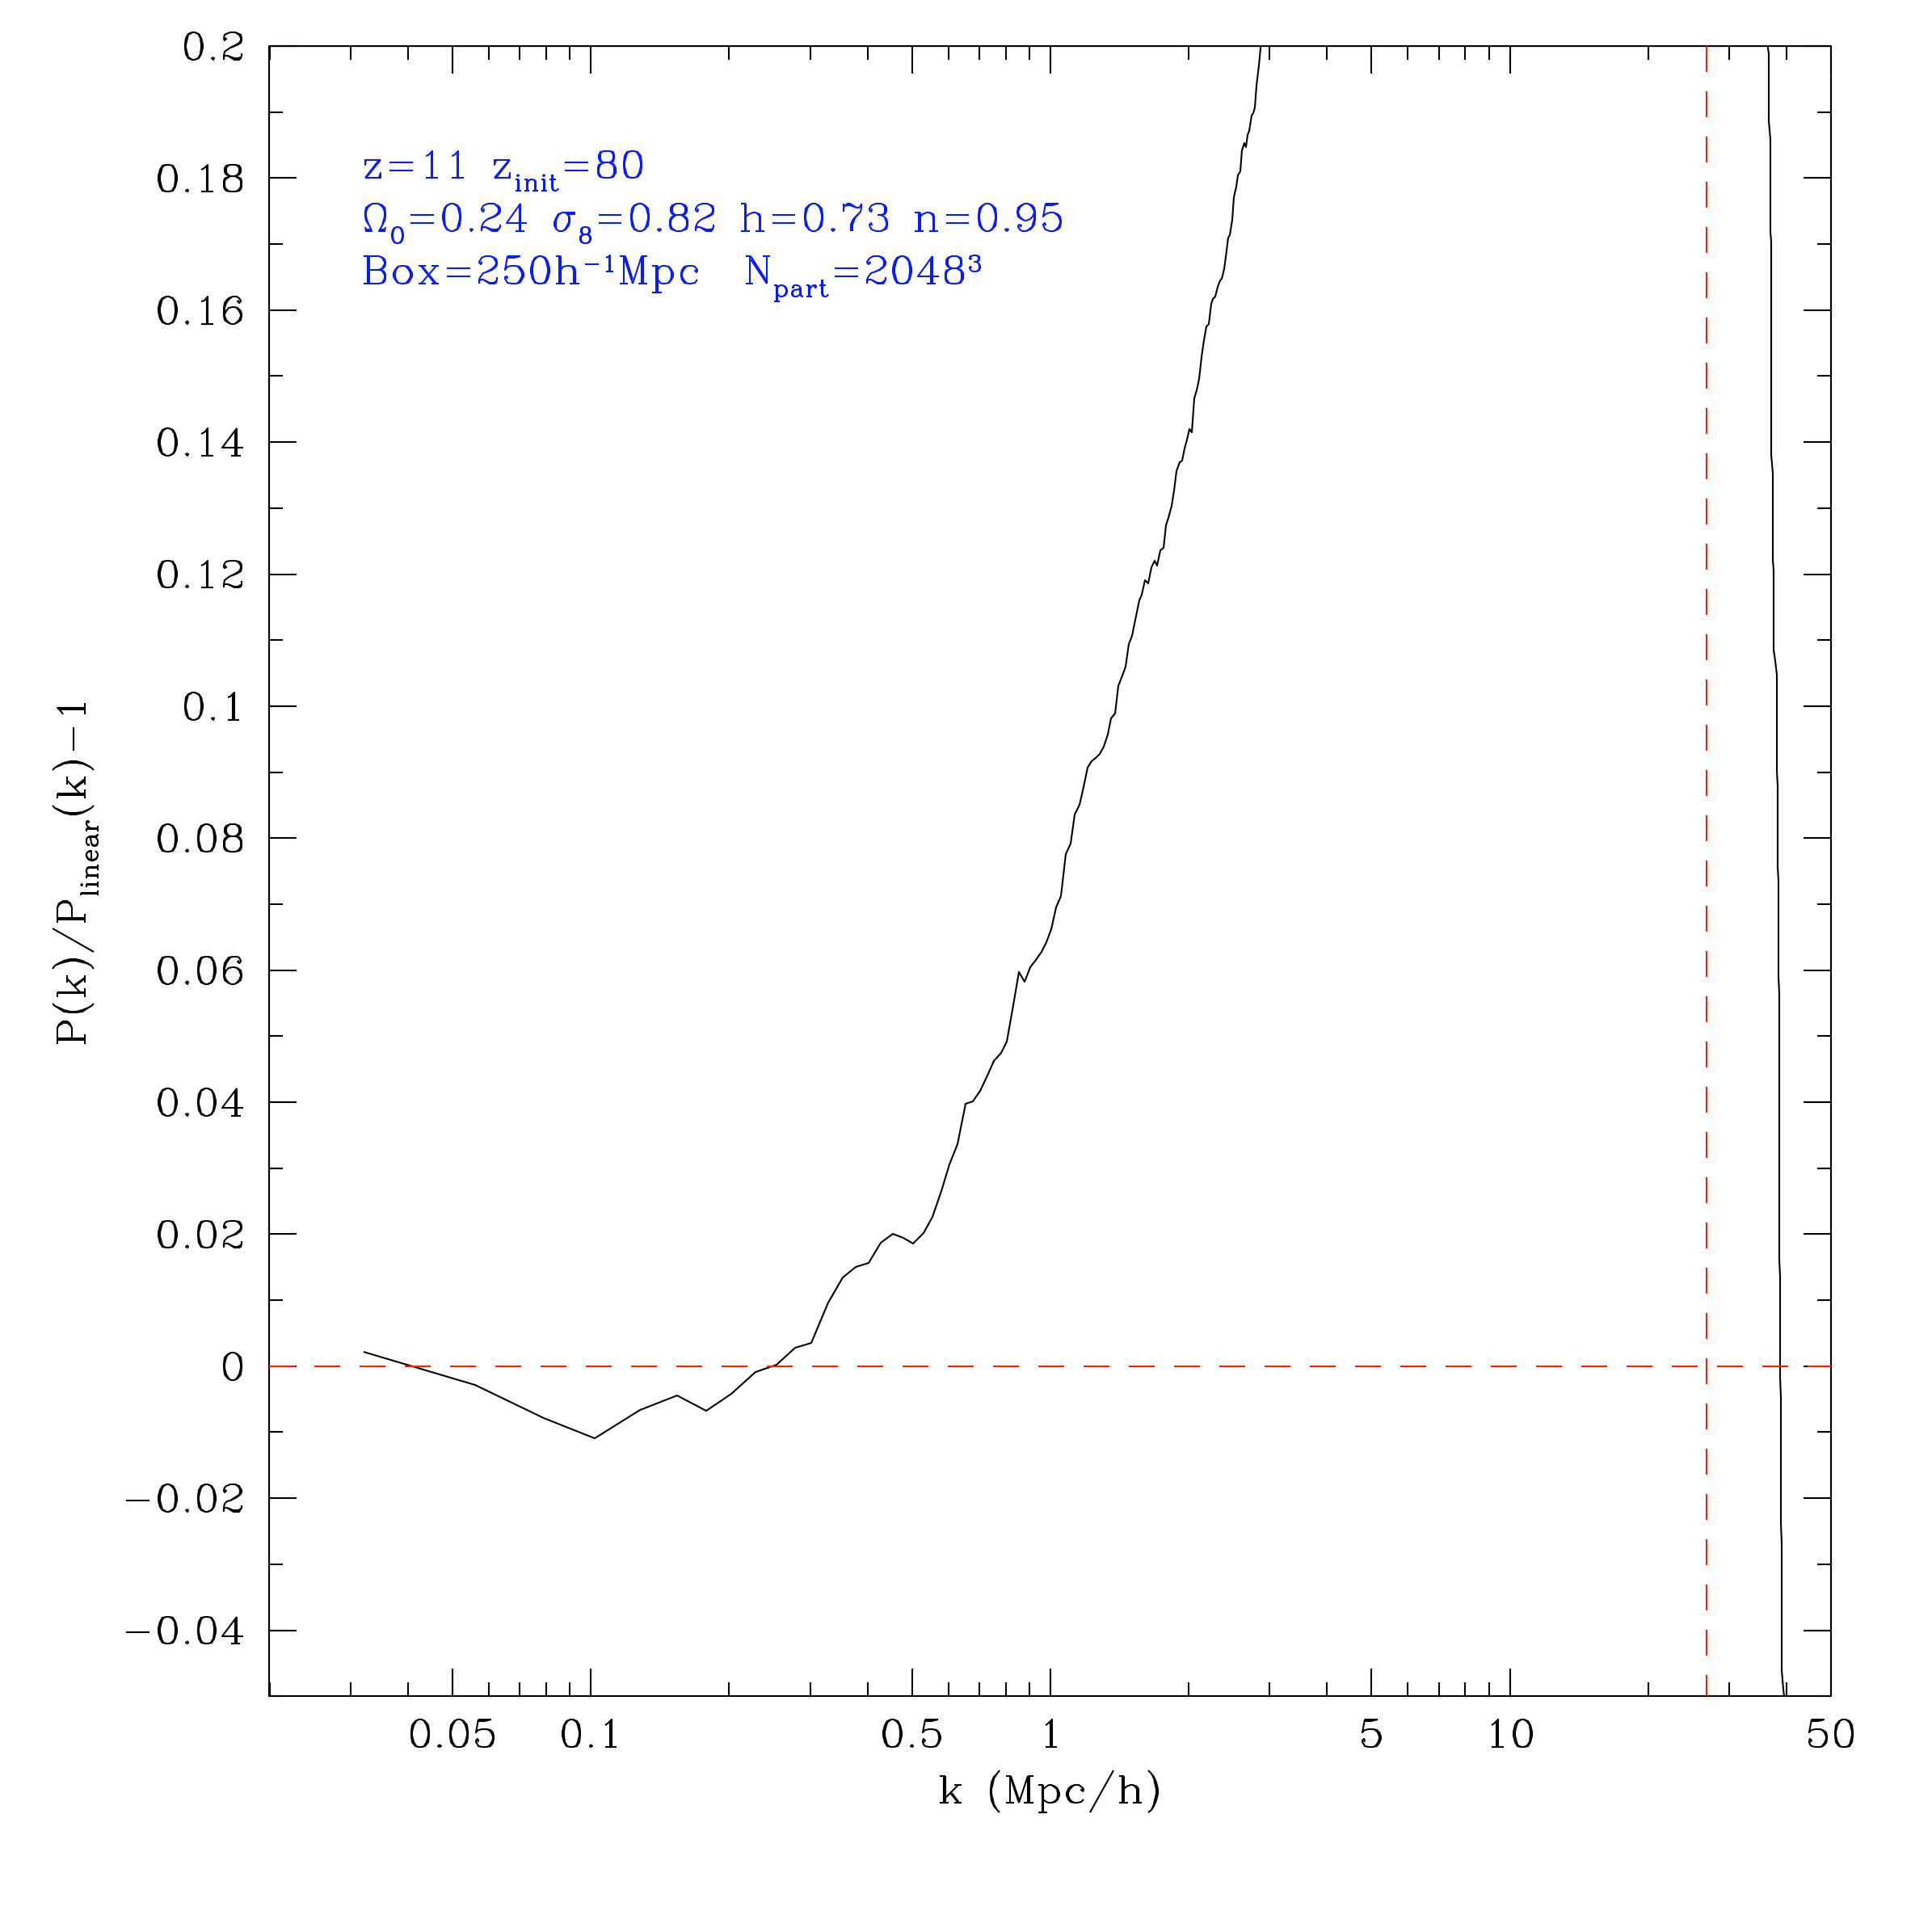
| Initial conditions were generated using PMpowerMp code. In this case we use table generated with CAMB code (pk_cambWMAP.dat), courtesy of Andrey Kravtsov. Initial rms of density fluctuations at z=80.0 in a 250Mpch box is deltaRho/rho =0.0856 for sigma8=0.820 and 2048**3 particles (Nyquist frequency defines upper cutoff of the spectrum with the low cutoff being the fundamental mode). The code uses the Zeldovich approximation, which provides accurate results only if density perturbation is less than unity. This should be valid at any point in space. In practice the fluctuations must be even smaller than unity for high accuracy. With 2048**3 =8G independent realizations of the density, one expects one particle in the box to have 6.5sigma fluctuation, which gives one particle with density 0.55. The first most dense 100 particles are expected to have density contrast 5.76*0.0856 = 0.49. In practice, we used N=4096**3 particles to make realization of the spectrum of fluctuations with a small correction in the amplitude of perturbations (rms =0.09957) and selected every 8th particle. This serves two purposes. In future we can re-run some fraction of the computational box with 8 time more particles while preserving the same realization of waves. Selecting every 8th particle also slightly boosts the fluctuations close to the Nyquist frequency, which CIC schemes of density assignment tend to dump. In Start one can find InStart.dat file, which was fed to PMstartMp to set initial conditions. Set of random numbers is provided by file Seeds.1.4096.09781091.dat
|