 |
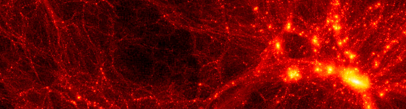
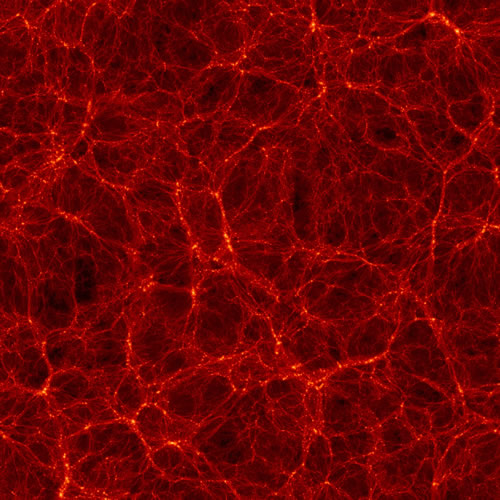
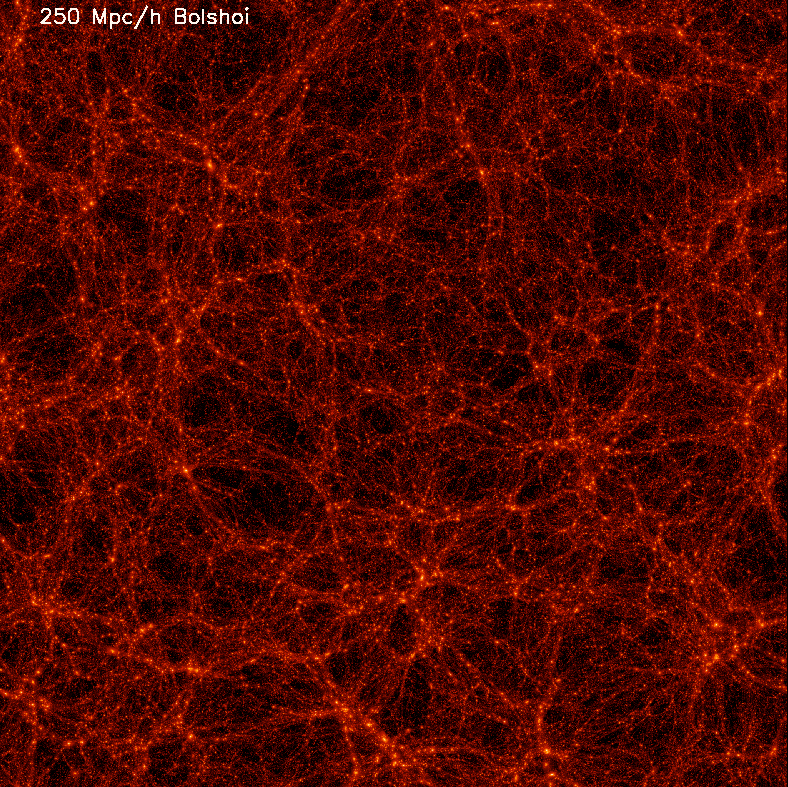
A slice of the whole 250Mpc box. Made by Stefan Gottlober (AIP) with IDL |
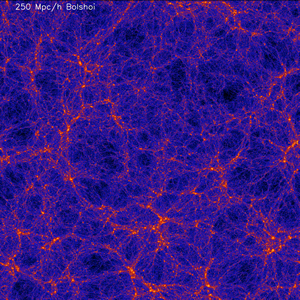 |
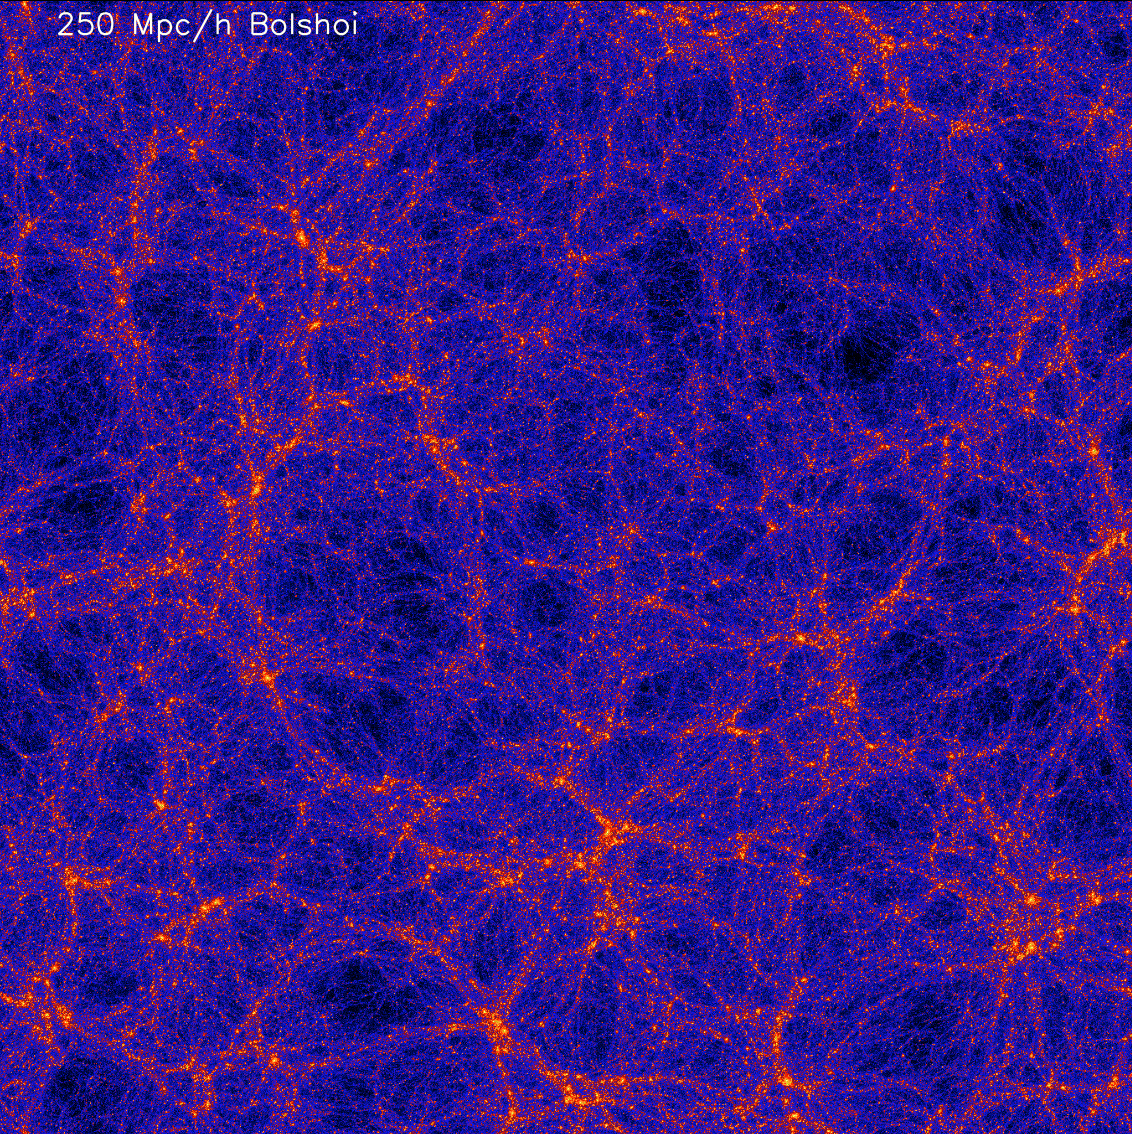
10Mpc slice at z=0 of the whole box. Shown is the maximum of density along the line of sight.
 High res red-palette image High res red-palette image 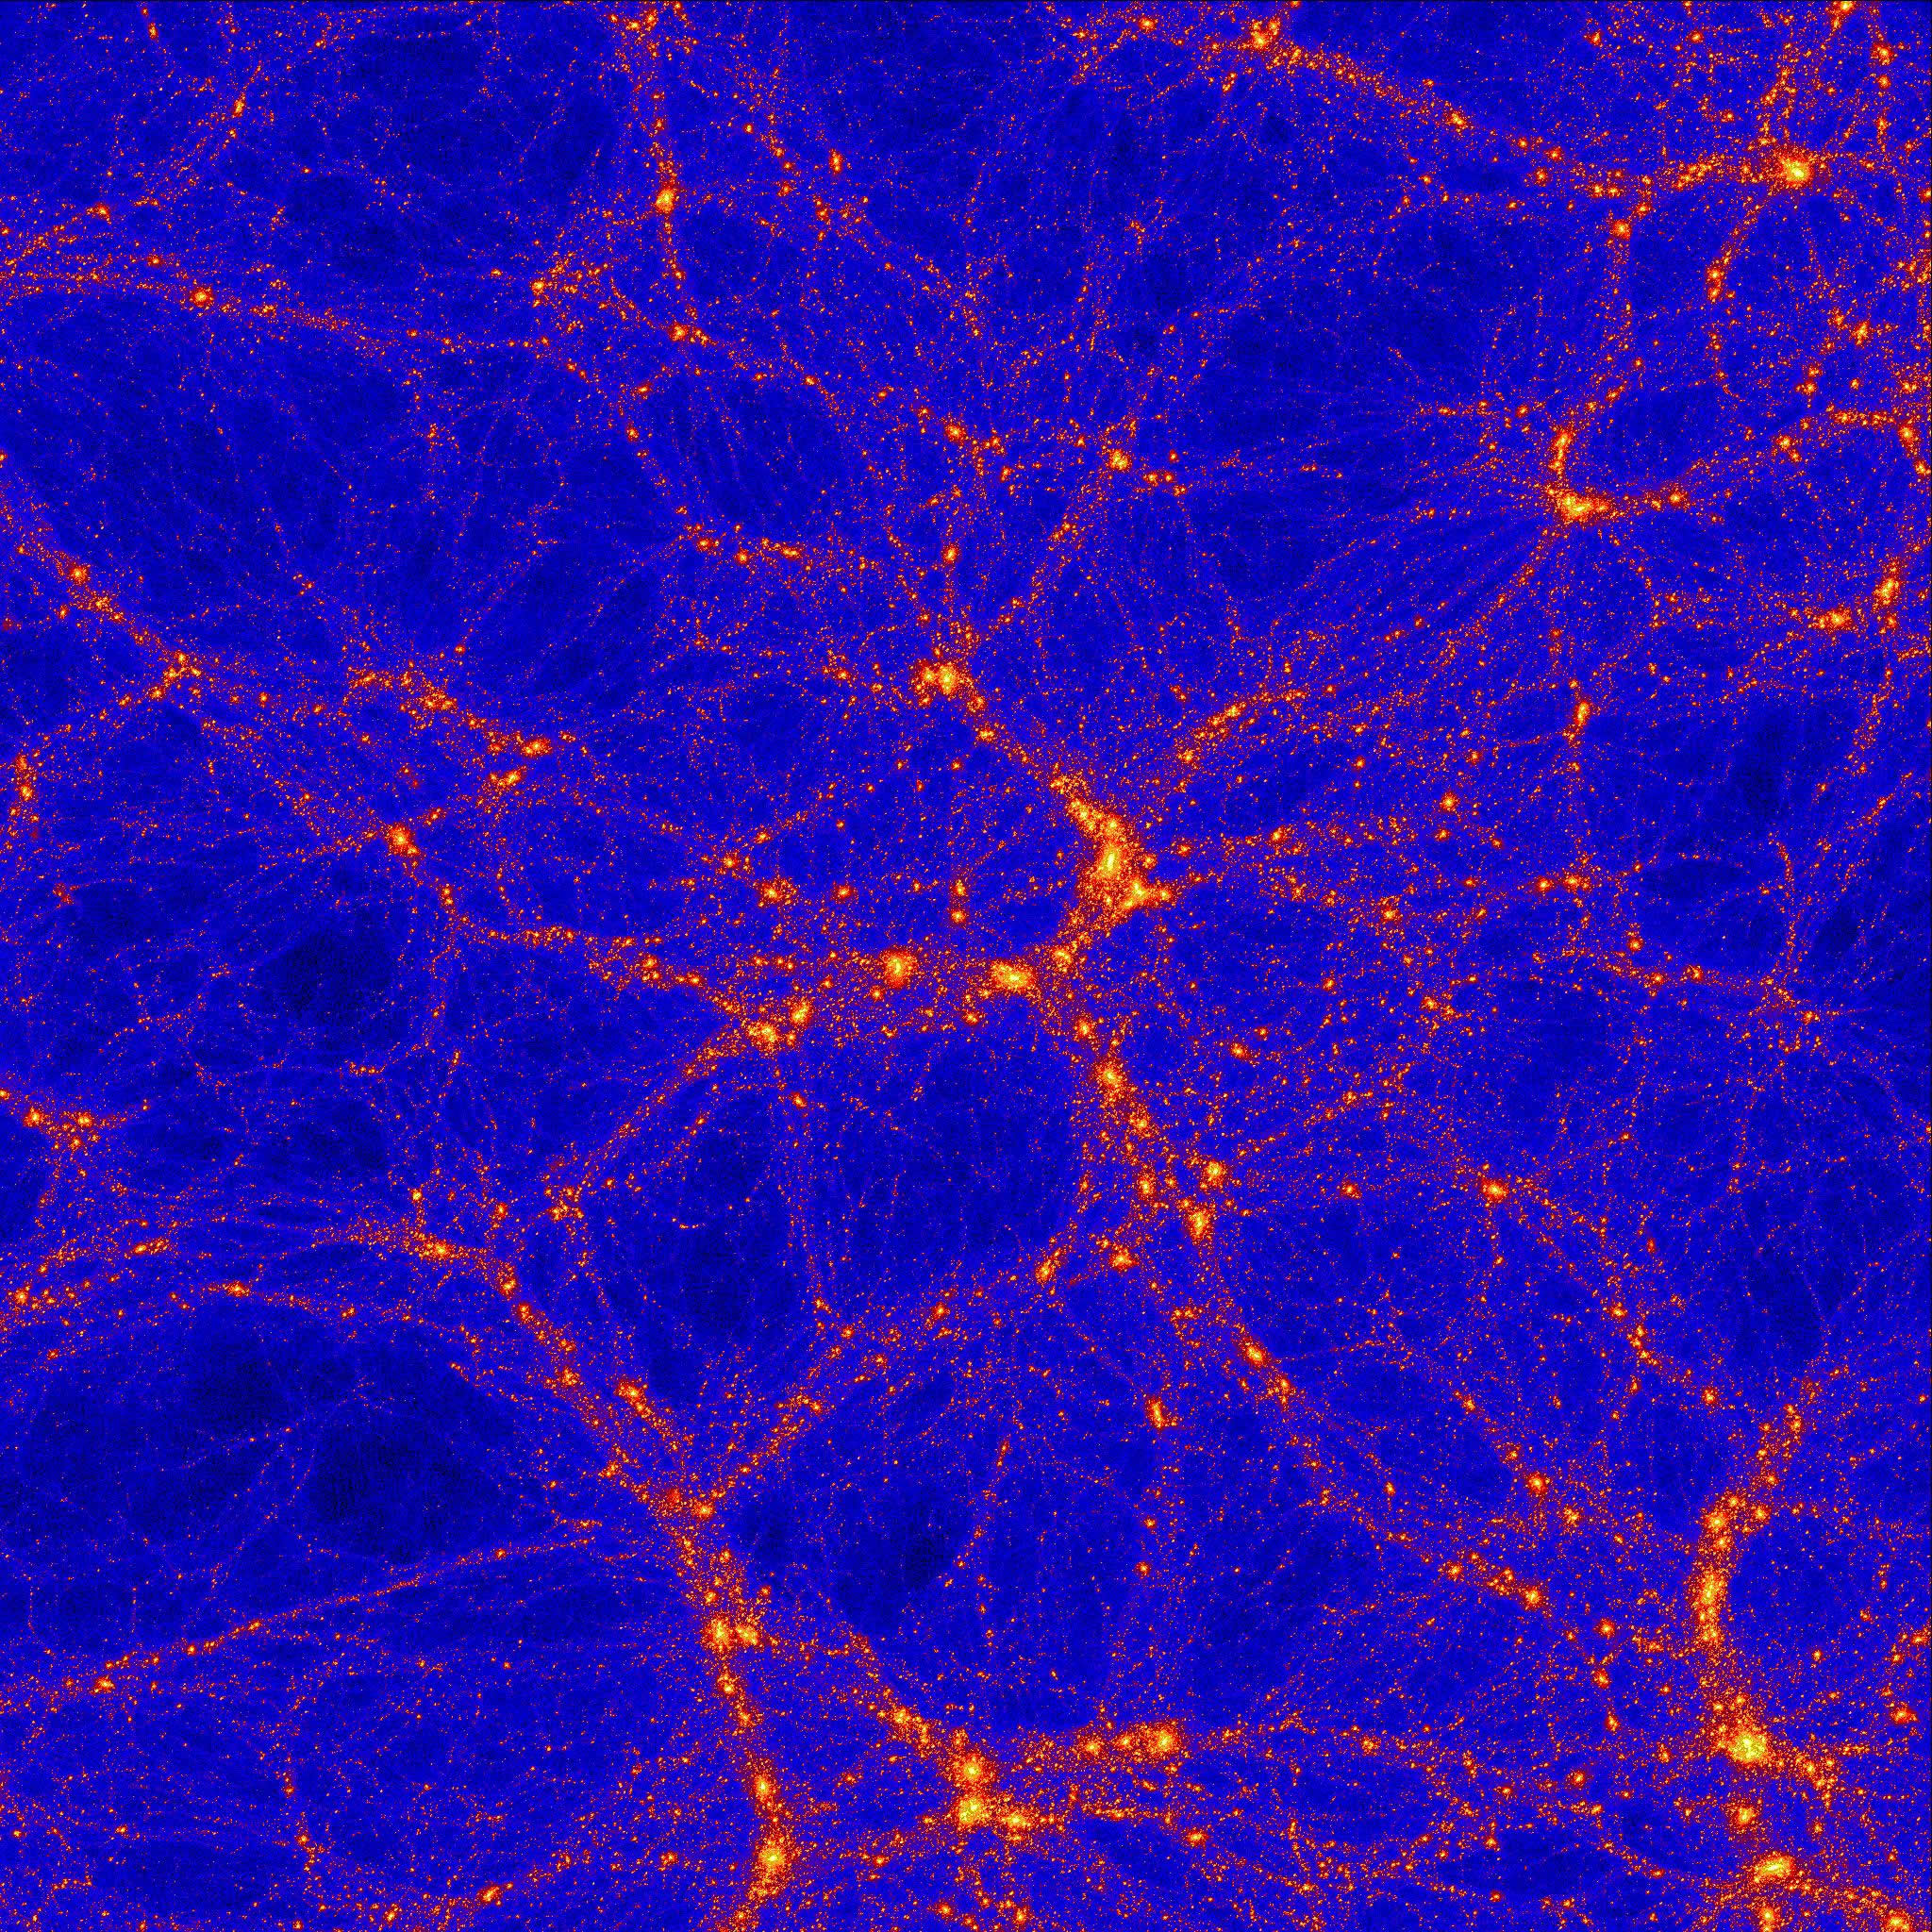 blue image blue image
|
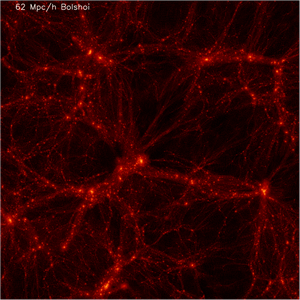 |
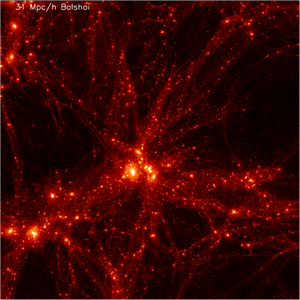
 Different Colors for 31Mpc; A B Different Colors for 31Mpc; A B |
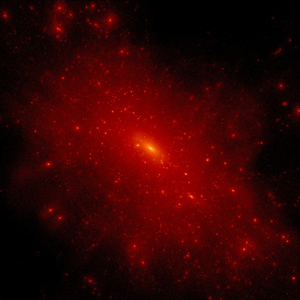 |
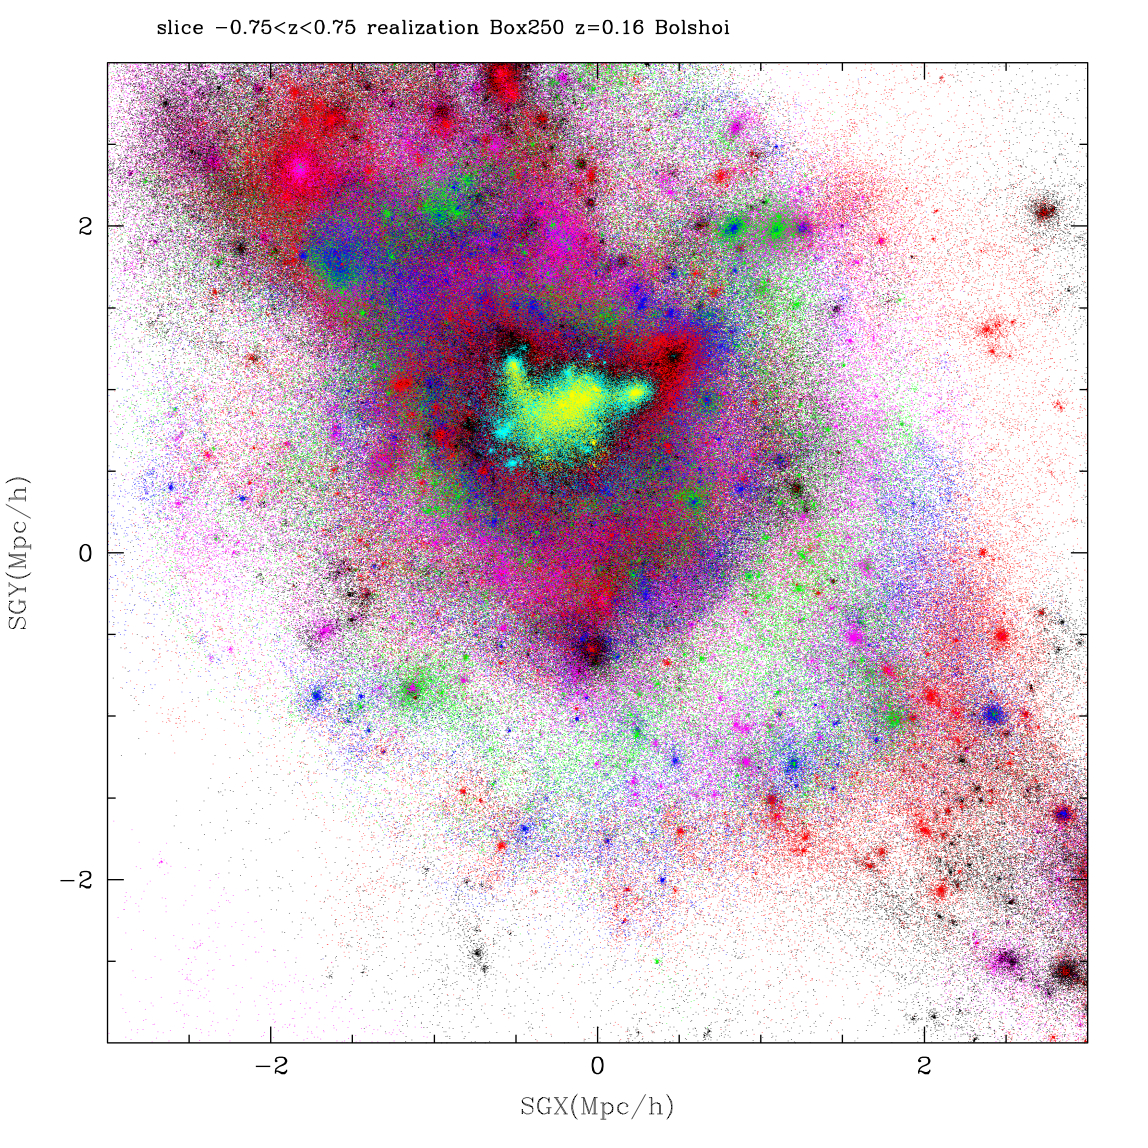
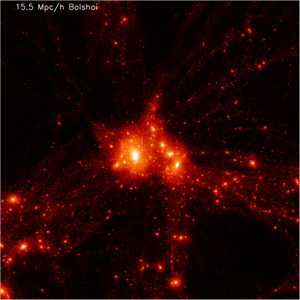
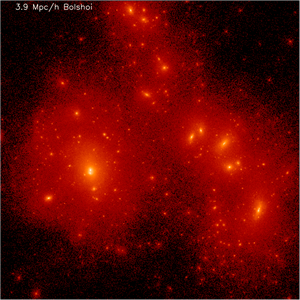
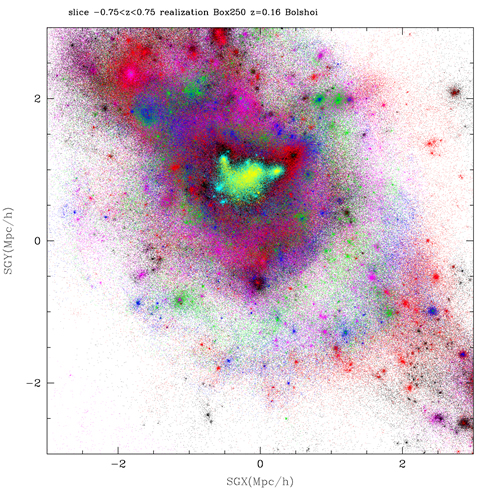
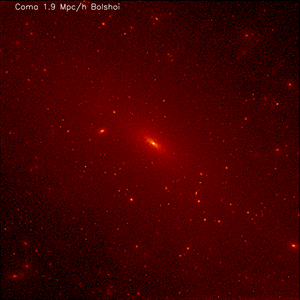 Largest cluster of "galaxies" in the simultion. Left frame: 7.7Mpch diameter. Right: 1.9Mpc/h Largest cluster of "galaxies" in the simultion. Left frame: 7.7Mpch diameter. Right: 1.9Mpc/h |
| |
|
| Movie: High Resolution (127MB) |
Movie: High Resolution (227MB) Animations are made by Chris Henze, NASA Ames. Movies shows 20-30Mpc sphere centered on the largest cluster with virial radius 2.2Mpc/h. Size of a dark sphere in the second animation is the virial radius. |
| |
|
 |
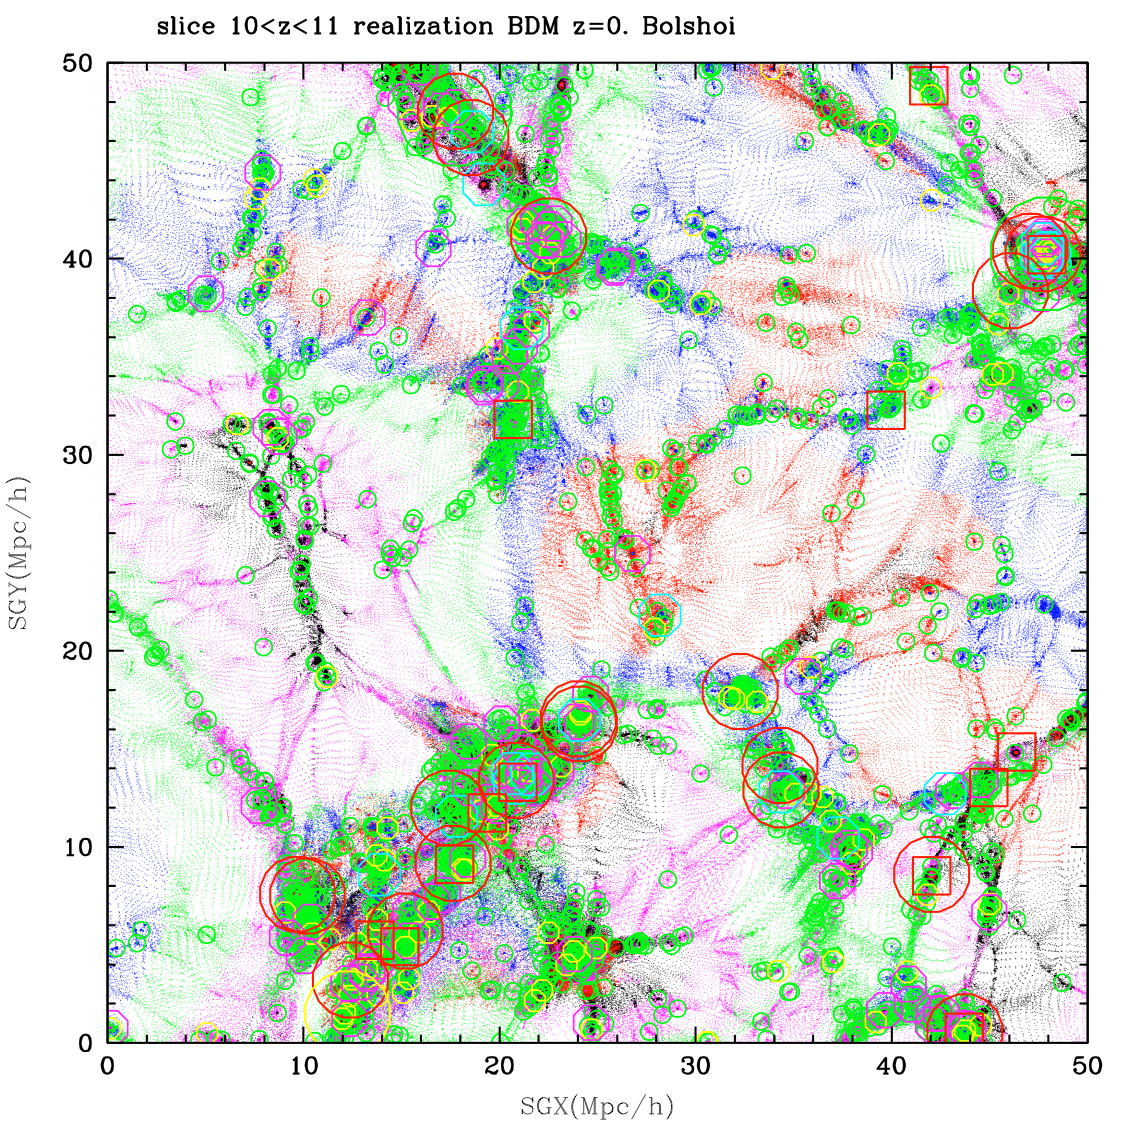
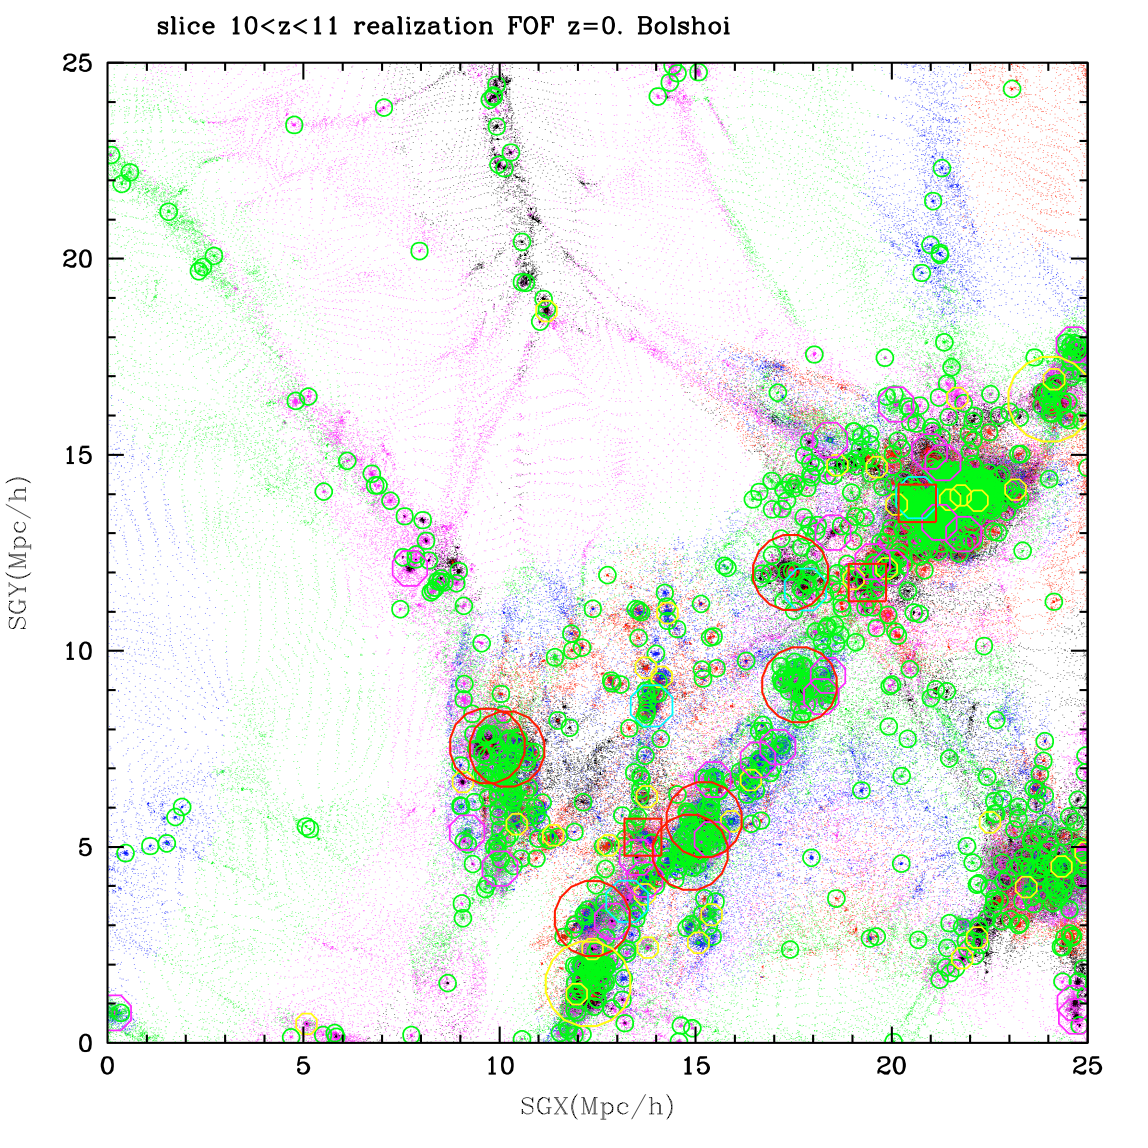
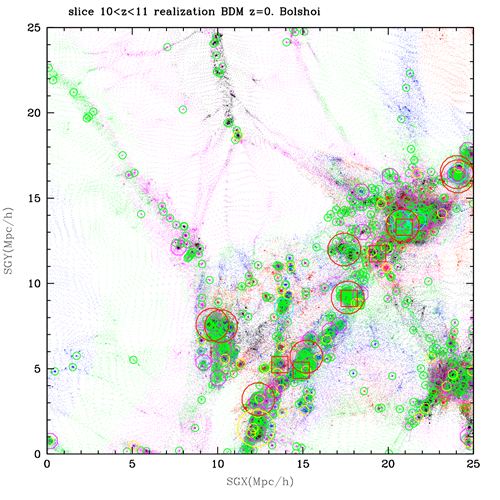
Dark matter particles are overlaid with halos for a thin (1Mpc) slice at redshift z=0. Color of particles indicates velocities. Size of halo is related with the maximum circular velocity. The smallest halos in the plot have Vcirc = 20km/s corresponding to 20-30 particles. Grid of particles seen in low-density environments is coming form initial conditions. In places where the line-of-sight goes along a raw of particles we have lumps and concentrations, which are projection effects. BDM halofinder, which operates in 3D space, does not identify those as halos. |
 |
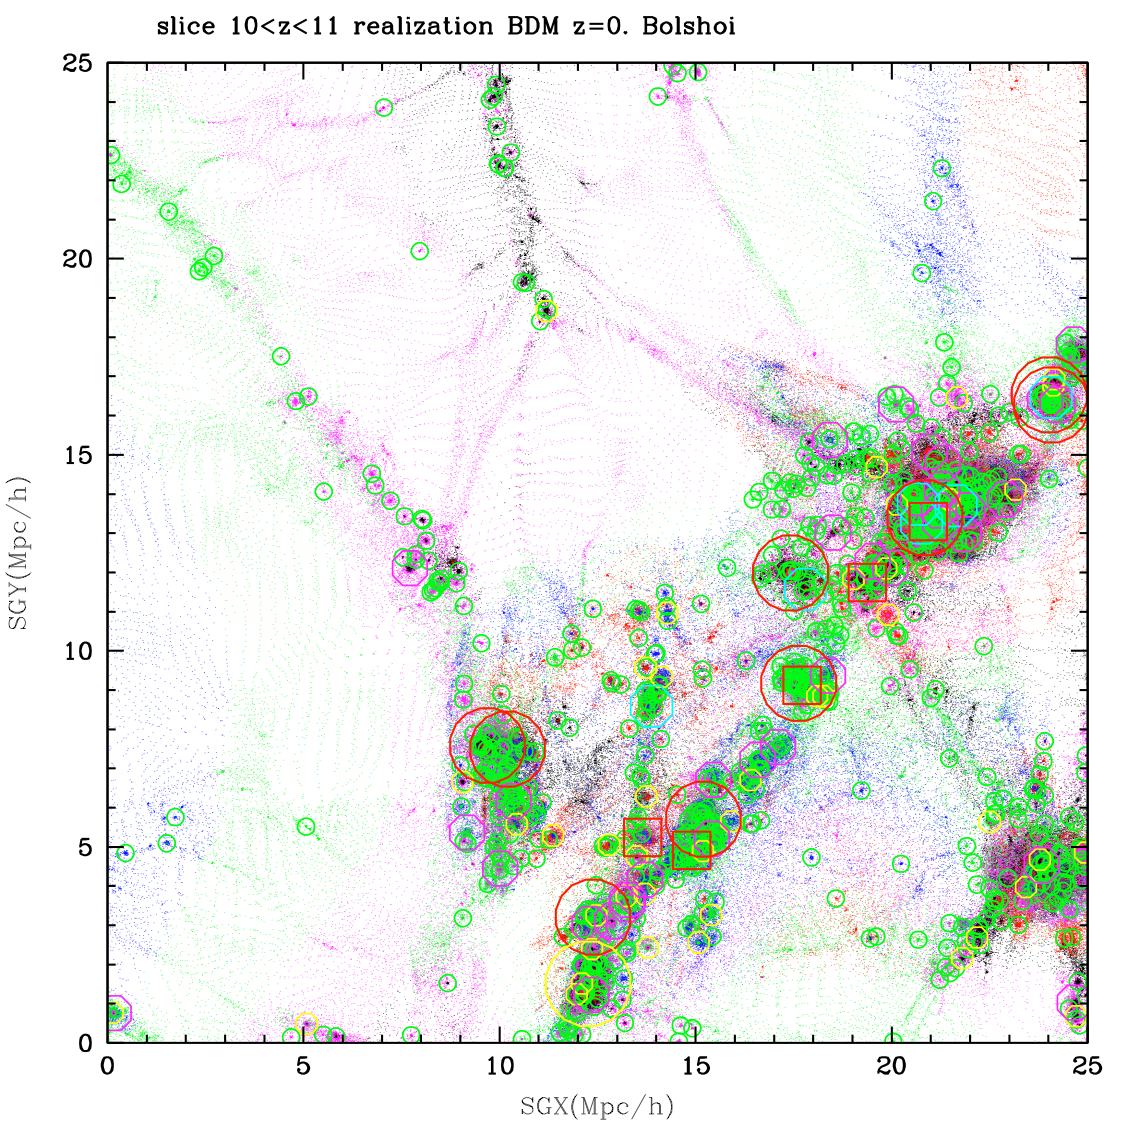
The same as previous plot, but for less crowded region. |
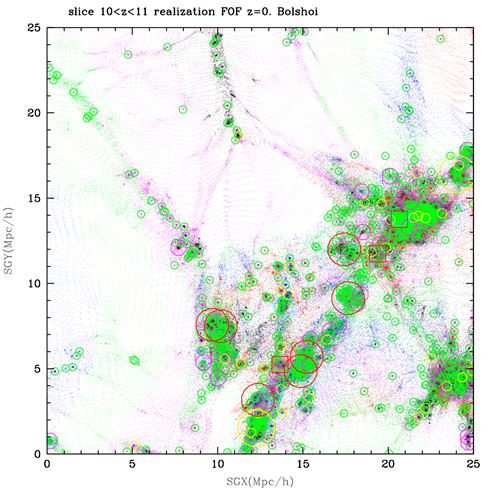 |
The same region with halos identified with Friends-of-Friends algorithm (Gottloeber, AIP). Compare this and previous plot. FOF finds more of very small halos. Overall, there is good correspondence between the codes for distinct halos.
|
 |
Dark matter particles in a slice. Particles colored by their velocity. |
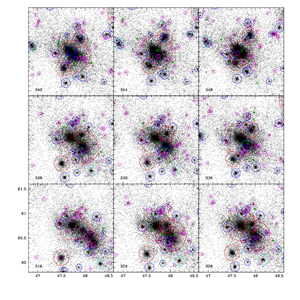 |
Identification of halos during a major merger event at z=0.30. At the initial moment (expansion parameter a=0.70) halo in the bottom left panel had virial mass 2e12Msun and maximum circular velocity V=222km/s. At the latest shown moment of z=0.25 (righ top panel) the halo has mass 3.3e12Msun and Vcirc =287km/s. Radii of circles are equal to virial radii (or trunction) for every subhalo identified by BDM. 1/2 of all dark matter particles is shown.
Numbers in the left-bottom corners of each panel show time-step for the snapshot with the latest moment 348 corresponding to a =0.796 (z =0.25). During the merging of two largest halos (middle section, snapshots 328-336) the halo finder may either miss one of the halos (snpshot 328) or underestimate its mass (snapshot 330) |
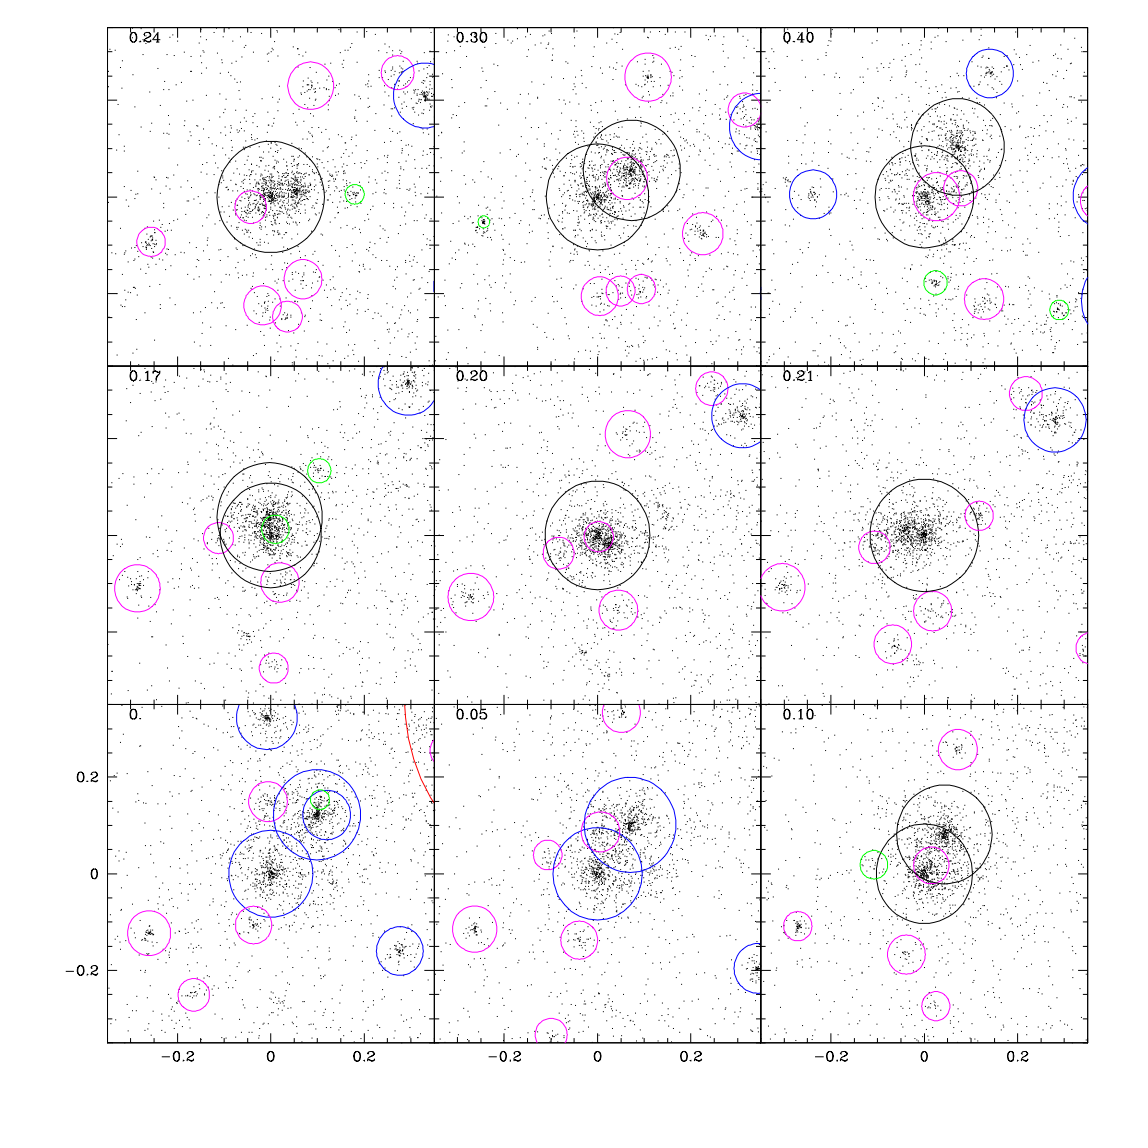 |
Two halos on a elongated orbit. Redshift is shown on top left corner of each snapshot. Radius of each circle shows the virial radius of halos. Two halos in the central region of each plot have viral mass about 1e11 solar mass and 600-800 particles.
Halo at the center at z=0 was a distinct halo. At z=0.17 (the left column, middle row) it became a subhalo. It was not identified as either halo or subhalo until z=0.3 when it was a distinct halo. From z=0.3 to z=0.17 both halos can be identified in the distribution of particles. Both halos bind the whole halo. The halo finder was programmed to take only one halo. Alternatively we can allow for both halos to exist during that period, but halos will have the same mass and will be inside virial radius of the other halo creating a double with nearly the same properties. This happens because the whole region is bound and halos, being on alongated orbits, do not experience much of dynamical friction. |